AI Insights
Collate AI lets you ask questions about your data in plain language and get back AI insights as charts — instantly. You don’t need to know SQL, where the data lives, or how to build a report. Just ask, and Collate AI figures out the rest. The charts Collate AI generates stay with the conversation where they were created, so you can come back to them later in that same chat. Pin charts to a dashboard when you want them collected in one place, easier to revisit, and ready to refresh or share with others.What You Can Do
- Ask Collate AI a business question in plain language and get back AI insights as charts.
- See exactly where each chart’s numbers come from so you can trust the result.
- Pin charts to a dashboard to collect and revisit them whenever you need.
- Schedule a recurring email report — ask Collate AI to send any chart or insight to your inbox on a set cadence.
- Export a chart as an image or download the data behind it as a spreadsheet.
- Invite teammates into a shared conversation — they can explore the same charts, ask follow-up questions, and continue the analysis right alongside you.
How Collate AI Analyzes Your Data
Before writing a single query, Collate AI reaches into your organization’s knowledge graph — the layer that holds your metric definitions, glossary terms, lineage, table schemas, and profiling data. This is what lets it give accurate answers without you having to explain your data model. Here’s what happens when you ask a question:- It finds the right definition first. If you ask about customer lifetime value, Collate AI looks up your organization’s agreed-upon formula from the business glossary — not a generic approximation. Every teammate who asks the same question gets the same canonical answer.
- It discovers the right tables and joins. Using lineage and schema metadata, Collate AI figures out which tables to query and how to join them — including intermediate tables that aren’t obvious from the question.
- It filters using real data. Column value filters come from profiler agent execution results — not guesses — so results reflect what’s actually in your data.
- It shows its work. SQL queries appear inline as Collate AI works through your question. You can see exactly what ran, which tables were used, and which definitions were applied — so you can verify the answer or hand the query off to your data team.
Before You Start
- Collate AI is enabled and your metadata is connected. If either isn’t set up yet, reach out to your admin.
- You need access to the data you want to analyze. If you don’t have it yet, you can request it through the Data Marketplace.
What Collate AI Can Do for You
- Answer questions: Type a question in plain language and Collate AI figures out what data to use and how to analyze it.
- Build charts: Charts appear right in your conversation as Collate AI works through your question. Ask follow-up questions to refine them.
- Show its work: Every chart links back to the data and logic behind it so you can verify the answer.
- Save to a dashboard: Pin any chart to a dashboard, no matter which conversation it came from. Refresh it on demand or schedule a recurring email report so your team always has the latest numbers.
- Share with teammates: Bring a colleague into the conversation so they see the same charts and reasoning — not just a screenshot.
Why AI Insights Over Manual Analysis?
If you’ve ever had to ask a data analyst for a report, waited days for it, then realized you needed a slightly different cut of the data — AI insights via Collate AI are for you. You get answers yourself, in minutes. Collate AI’s accuracy advantage comes from its knowledge graph — the semantic context layer built from your organization’s metadata, definitions, and lineage. Adding semantic context improves accuracy markedly: Anthropic’s analytics team documented a jump from ~20% to over 95%. Collate’s own benchmarks show accuracy rising from ~11% to over 76%. See blog AI for data needs a context layer. See how OpenAI and Anthropic do it.| The old way | AI insights | |
|---|---|---|
| Getting started | Find the right data, learn its structure, write a query | Just type your question |
| Using the right numbers | Look up or remember the formula | Collate AI uses your organization’s agreed-upon definitions automatically |
| Building a chart | Open a BI tool, configure chart types, set up axes | Charts appear in the conversation automatically |
| Trusting the result | Ask the data team to verify | Every chart links to the data and logic behind it |
| Sharing findings | Export a static image or share a dashboard link | Share the full conversation — teammates see the charts, context, and reasoning |
| Keeping results current | Rebuild or refresh dashboards manually | Pin charts to a dashboard and schedule a recurring email report — Collate AI keeps it fresh automatically |
| Access control | Set up separately in each tool | Uses your existing Collate permissions — nothing extra to configure |
Example Scenarios
Here’s how different people on the same team use Collate AI to generate AI insights — without stepping on each other’s work.-
Generating and Pinning an Insight
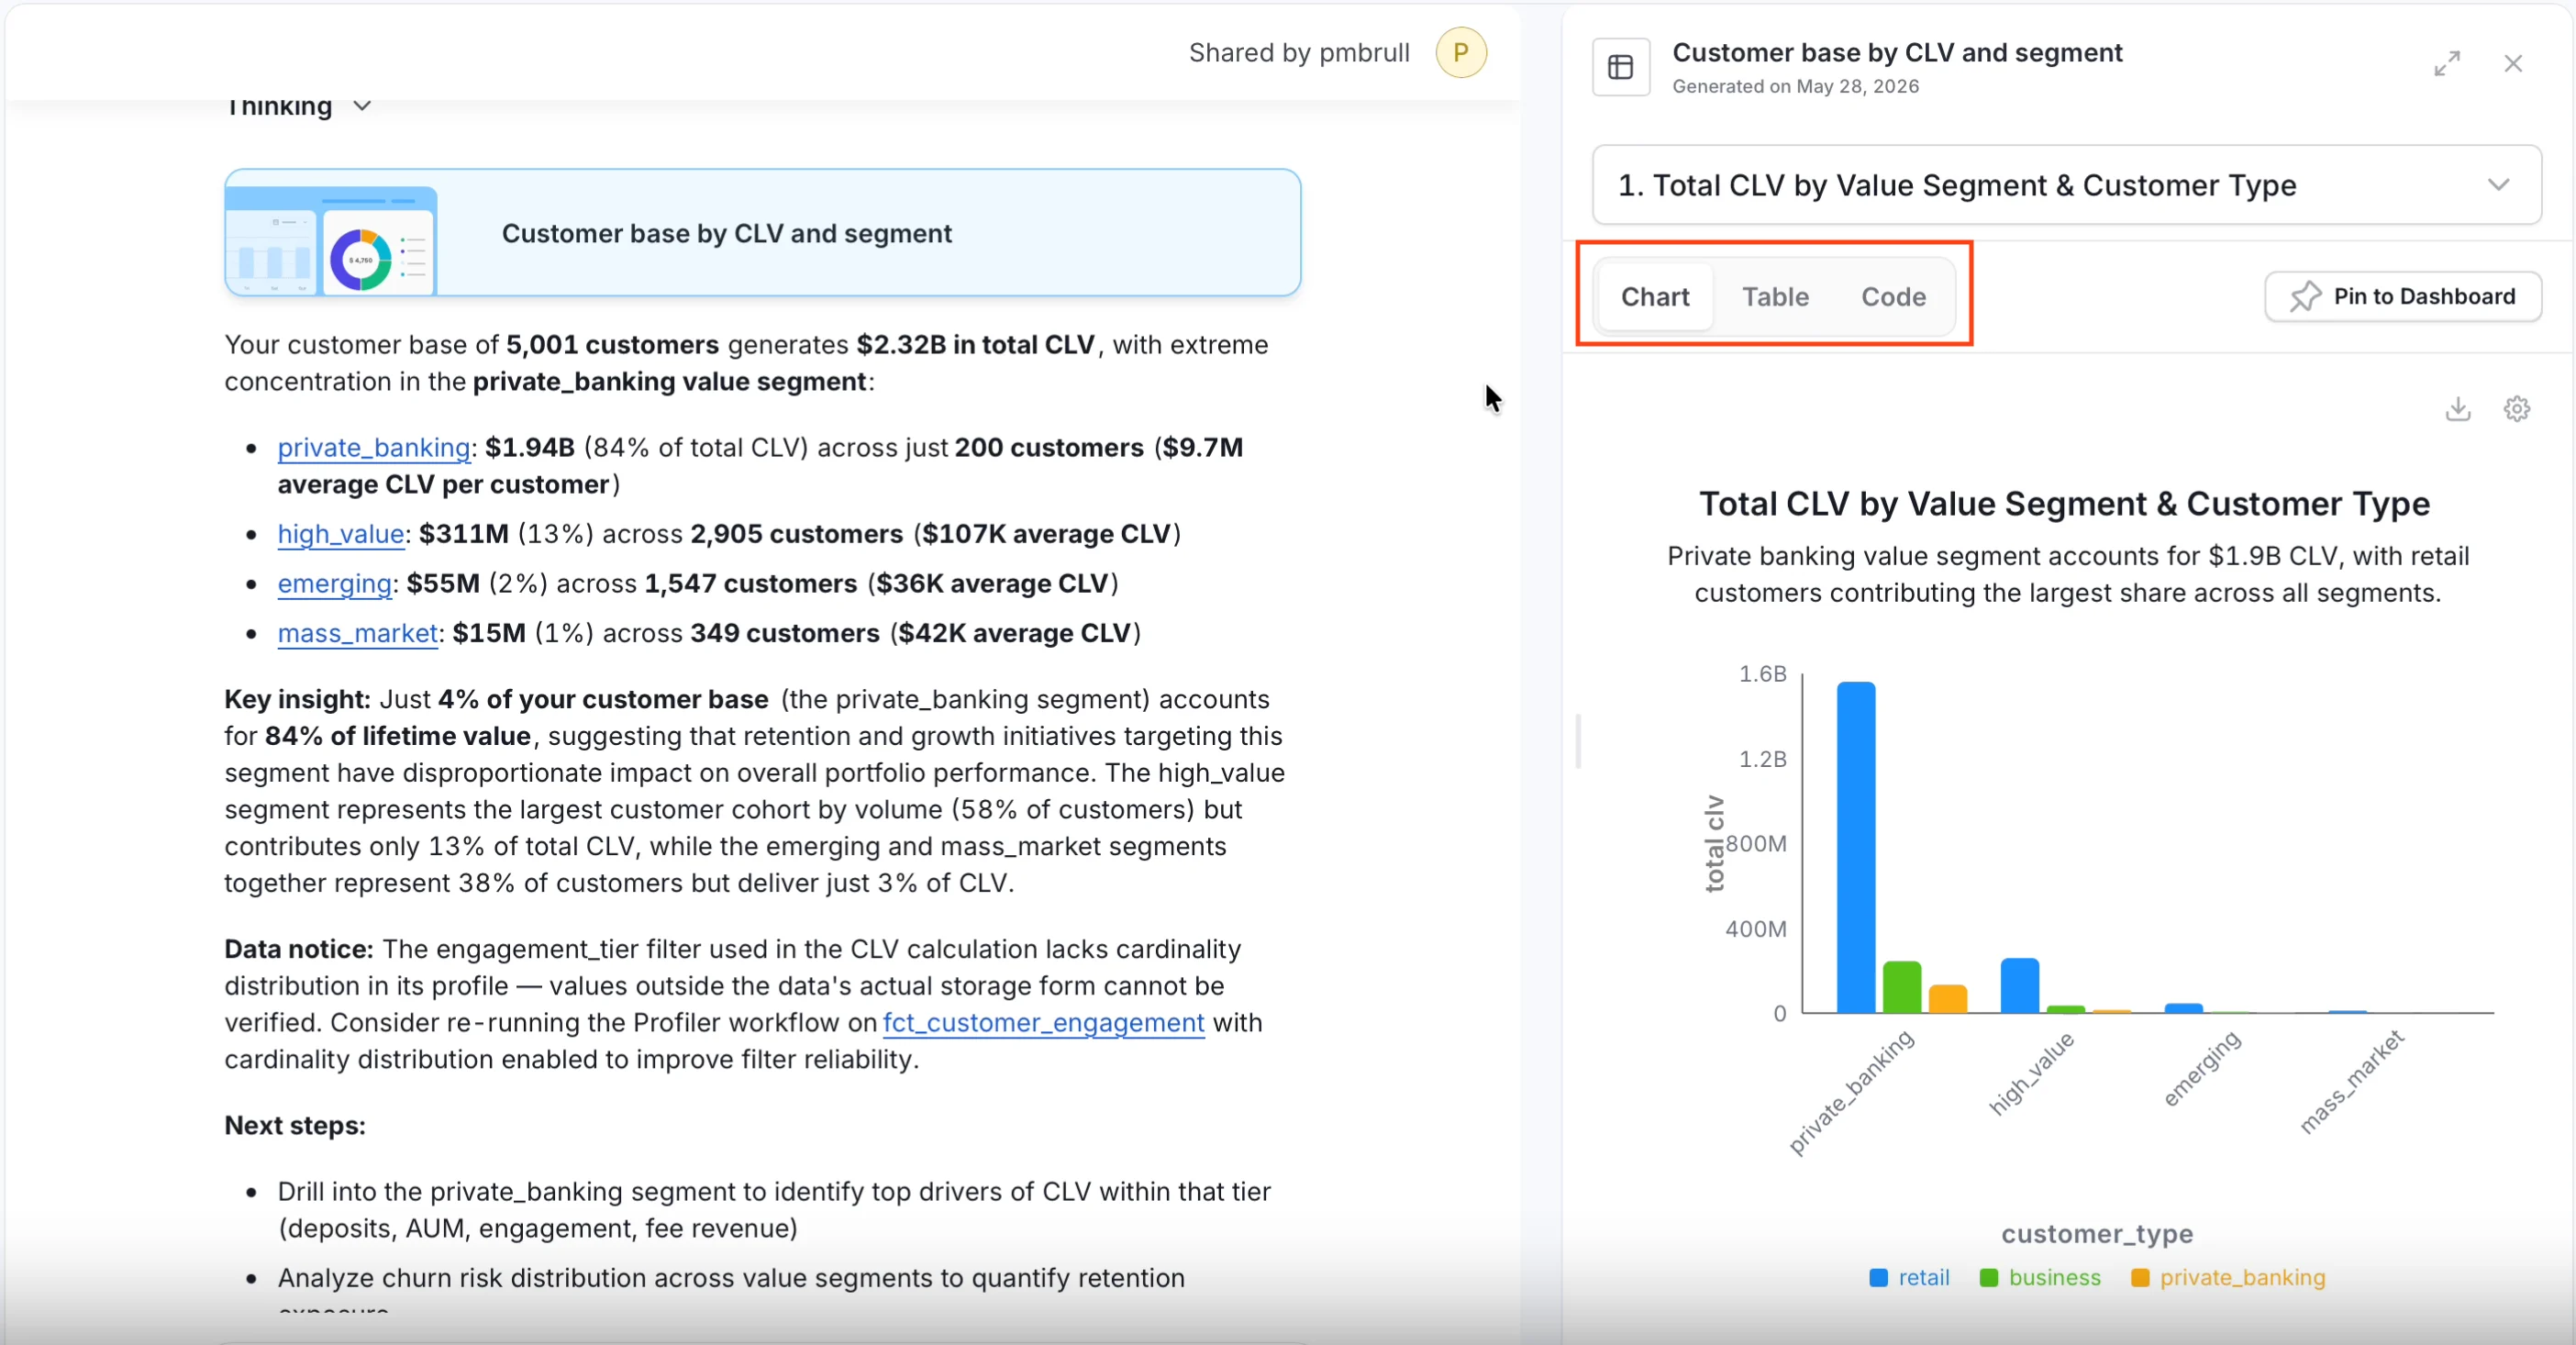
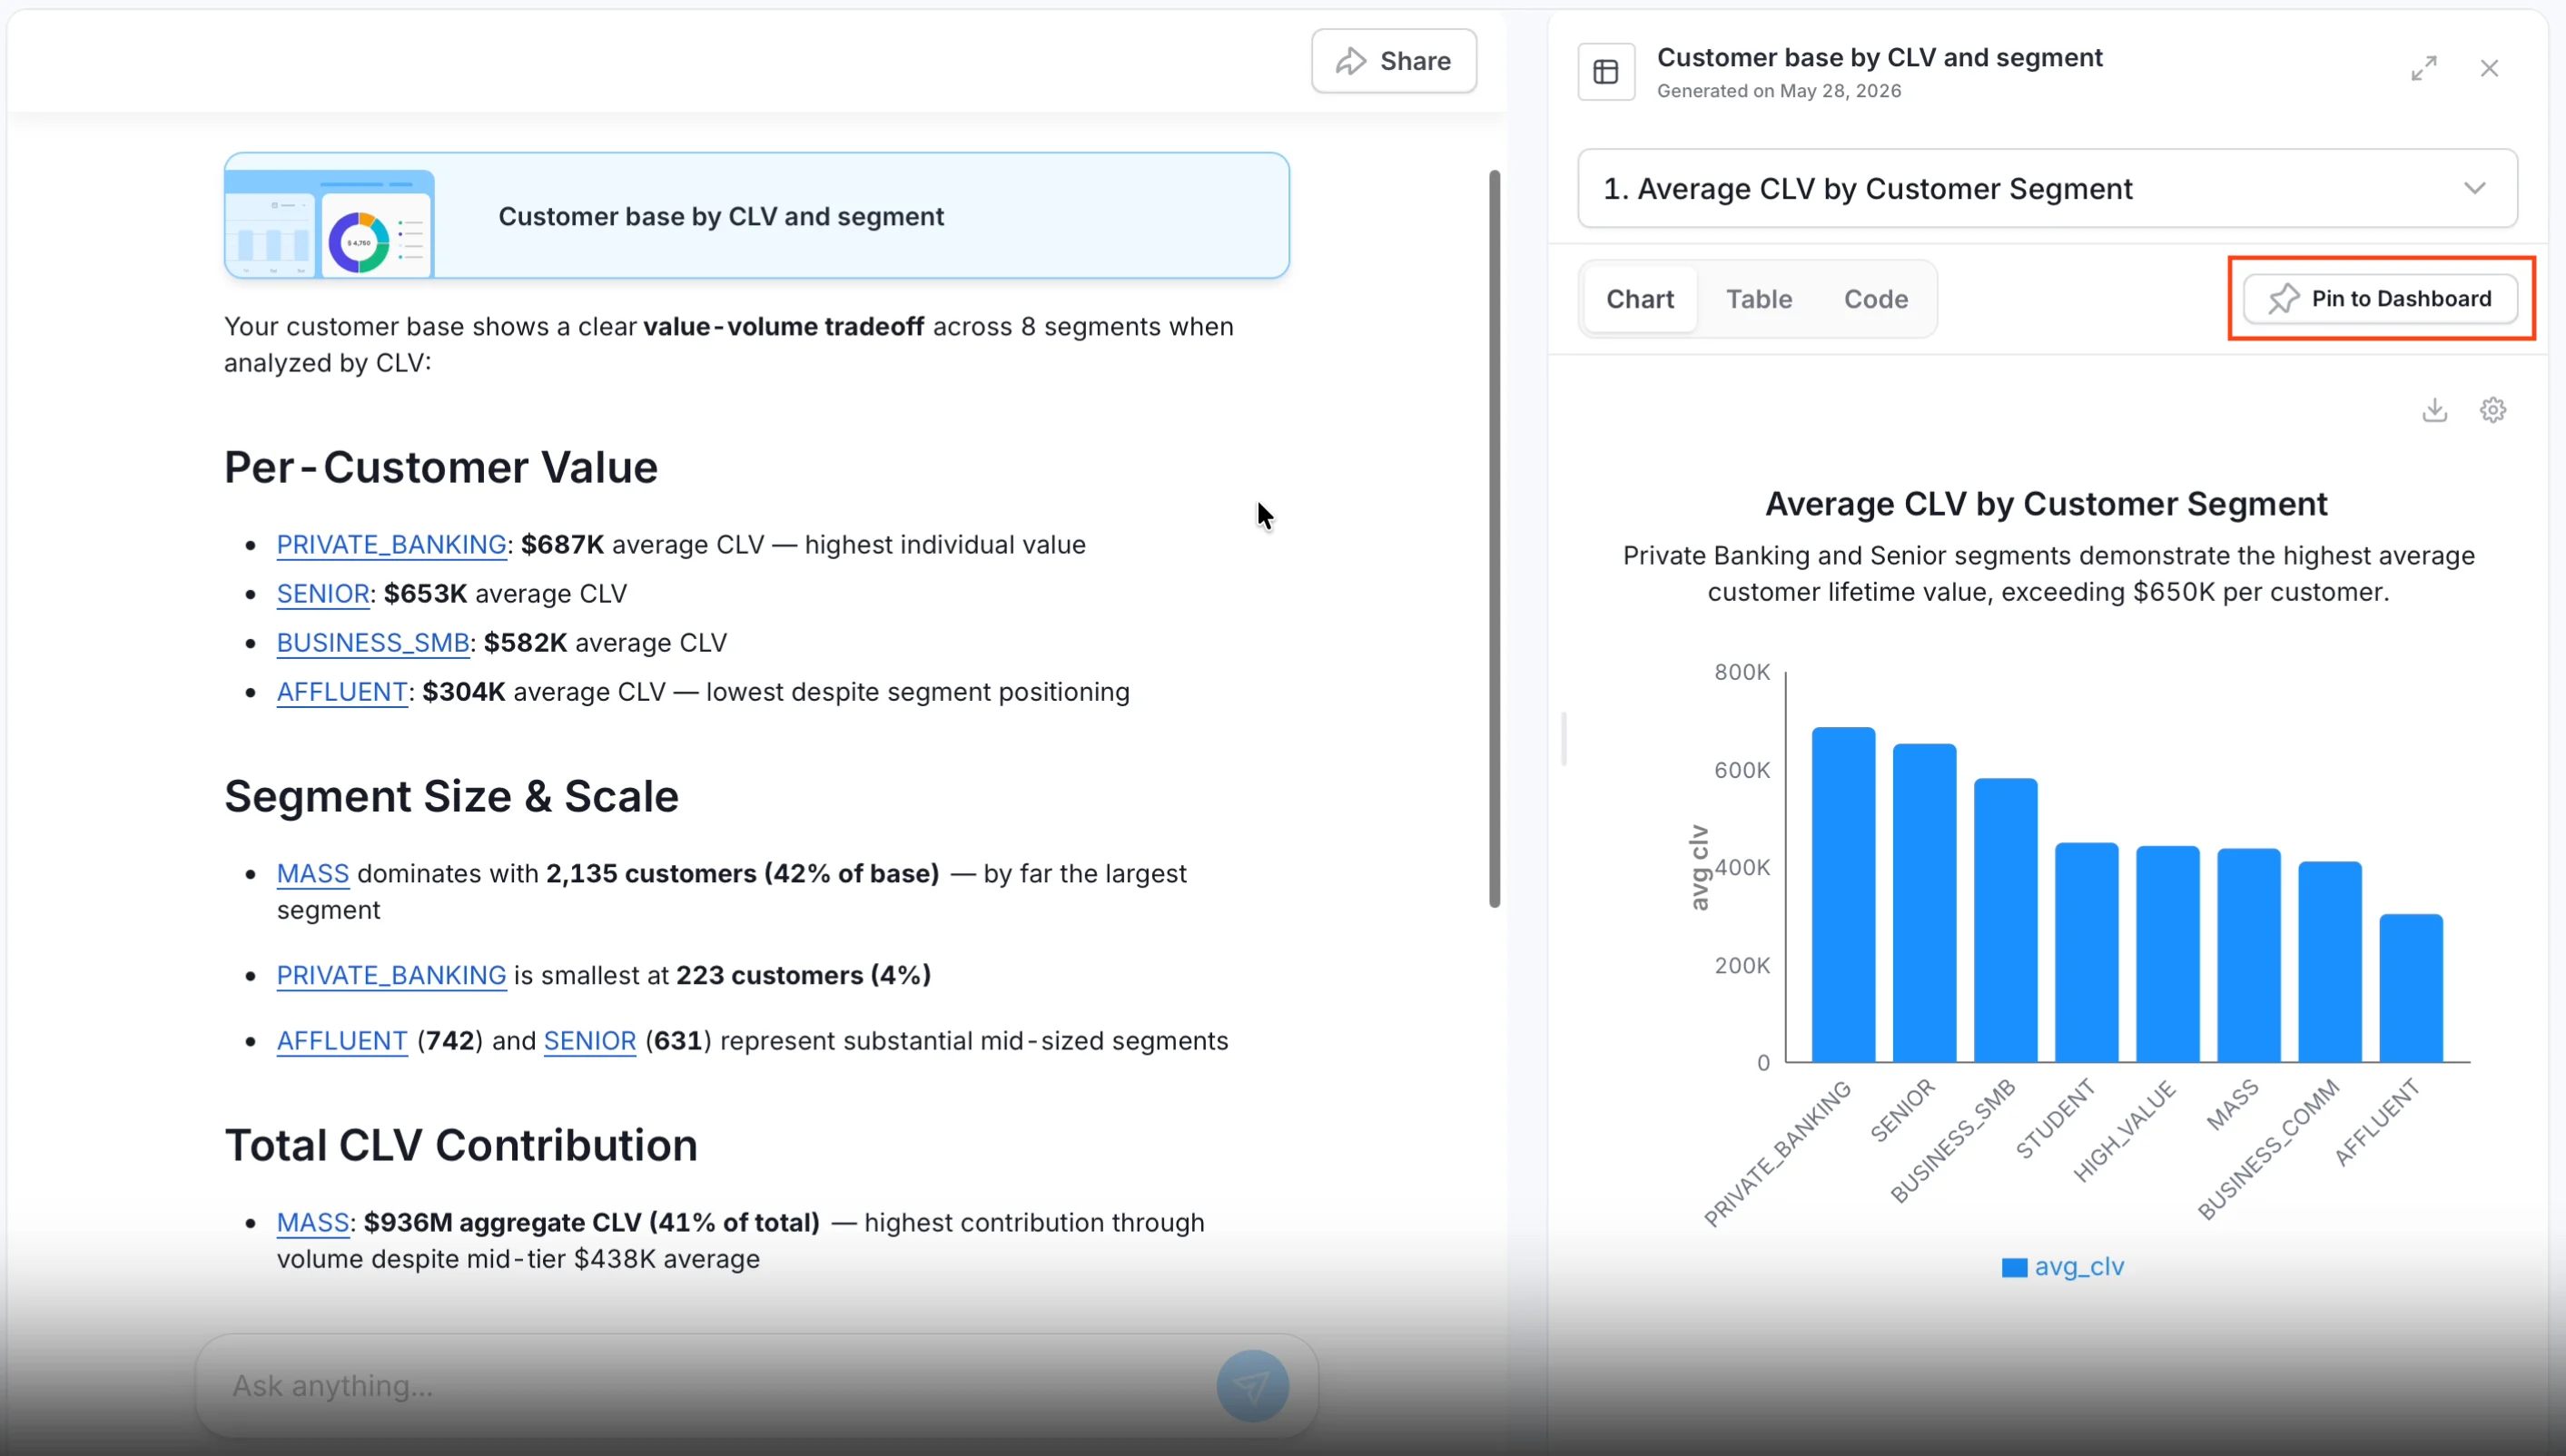
- Ask: “What does our customer base look like by lifetime value, broken out by segment?”
- What happens: Collate AI looks up the CLV formula from your business glossary, discovers the right tables (including fact tables for margins and churn risk), runs the joins, and returns three charts: average lifetime value by segment, customer count distribution, and total CLV contribution by segment.
- Result: Charts appear as bar, pie, donut, or summary cards depending on what fits best. Each links to the SQL query and reasoning behind it so you can verify the answer.
- Next step: Click Pin to dashboard on any chart to save it. Keep adding charts from other conversations to build a full picture over time.
-
Sharing a Conversation and Continuing the Analysis
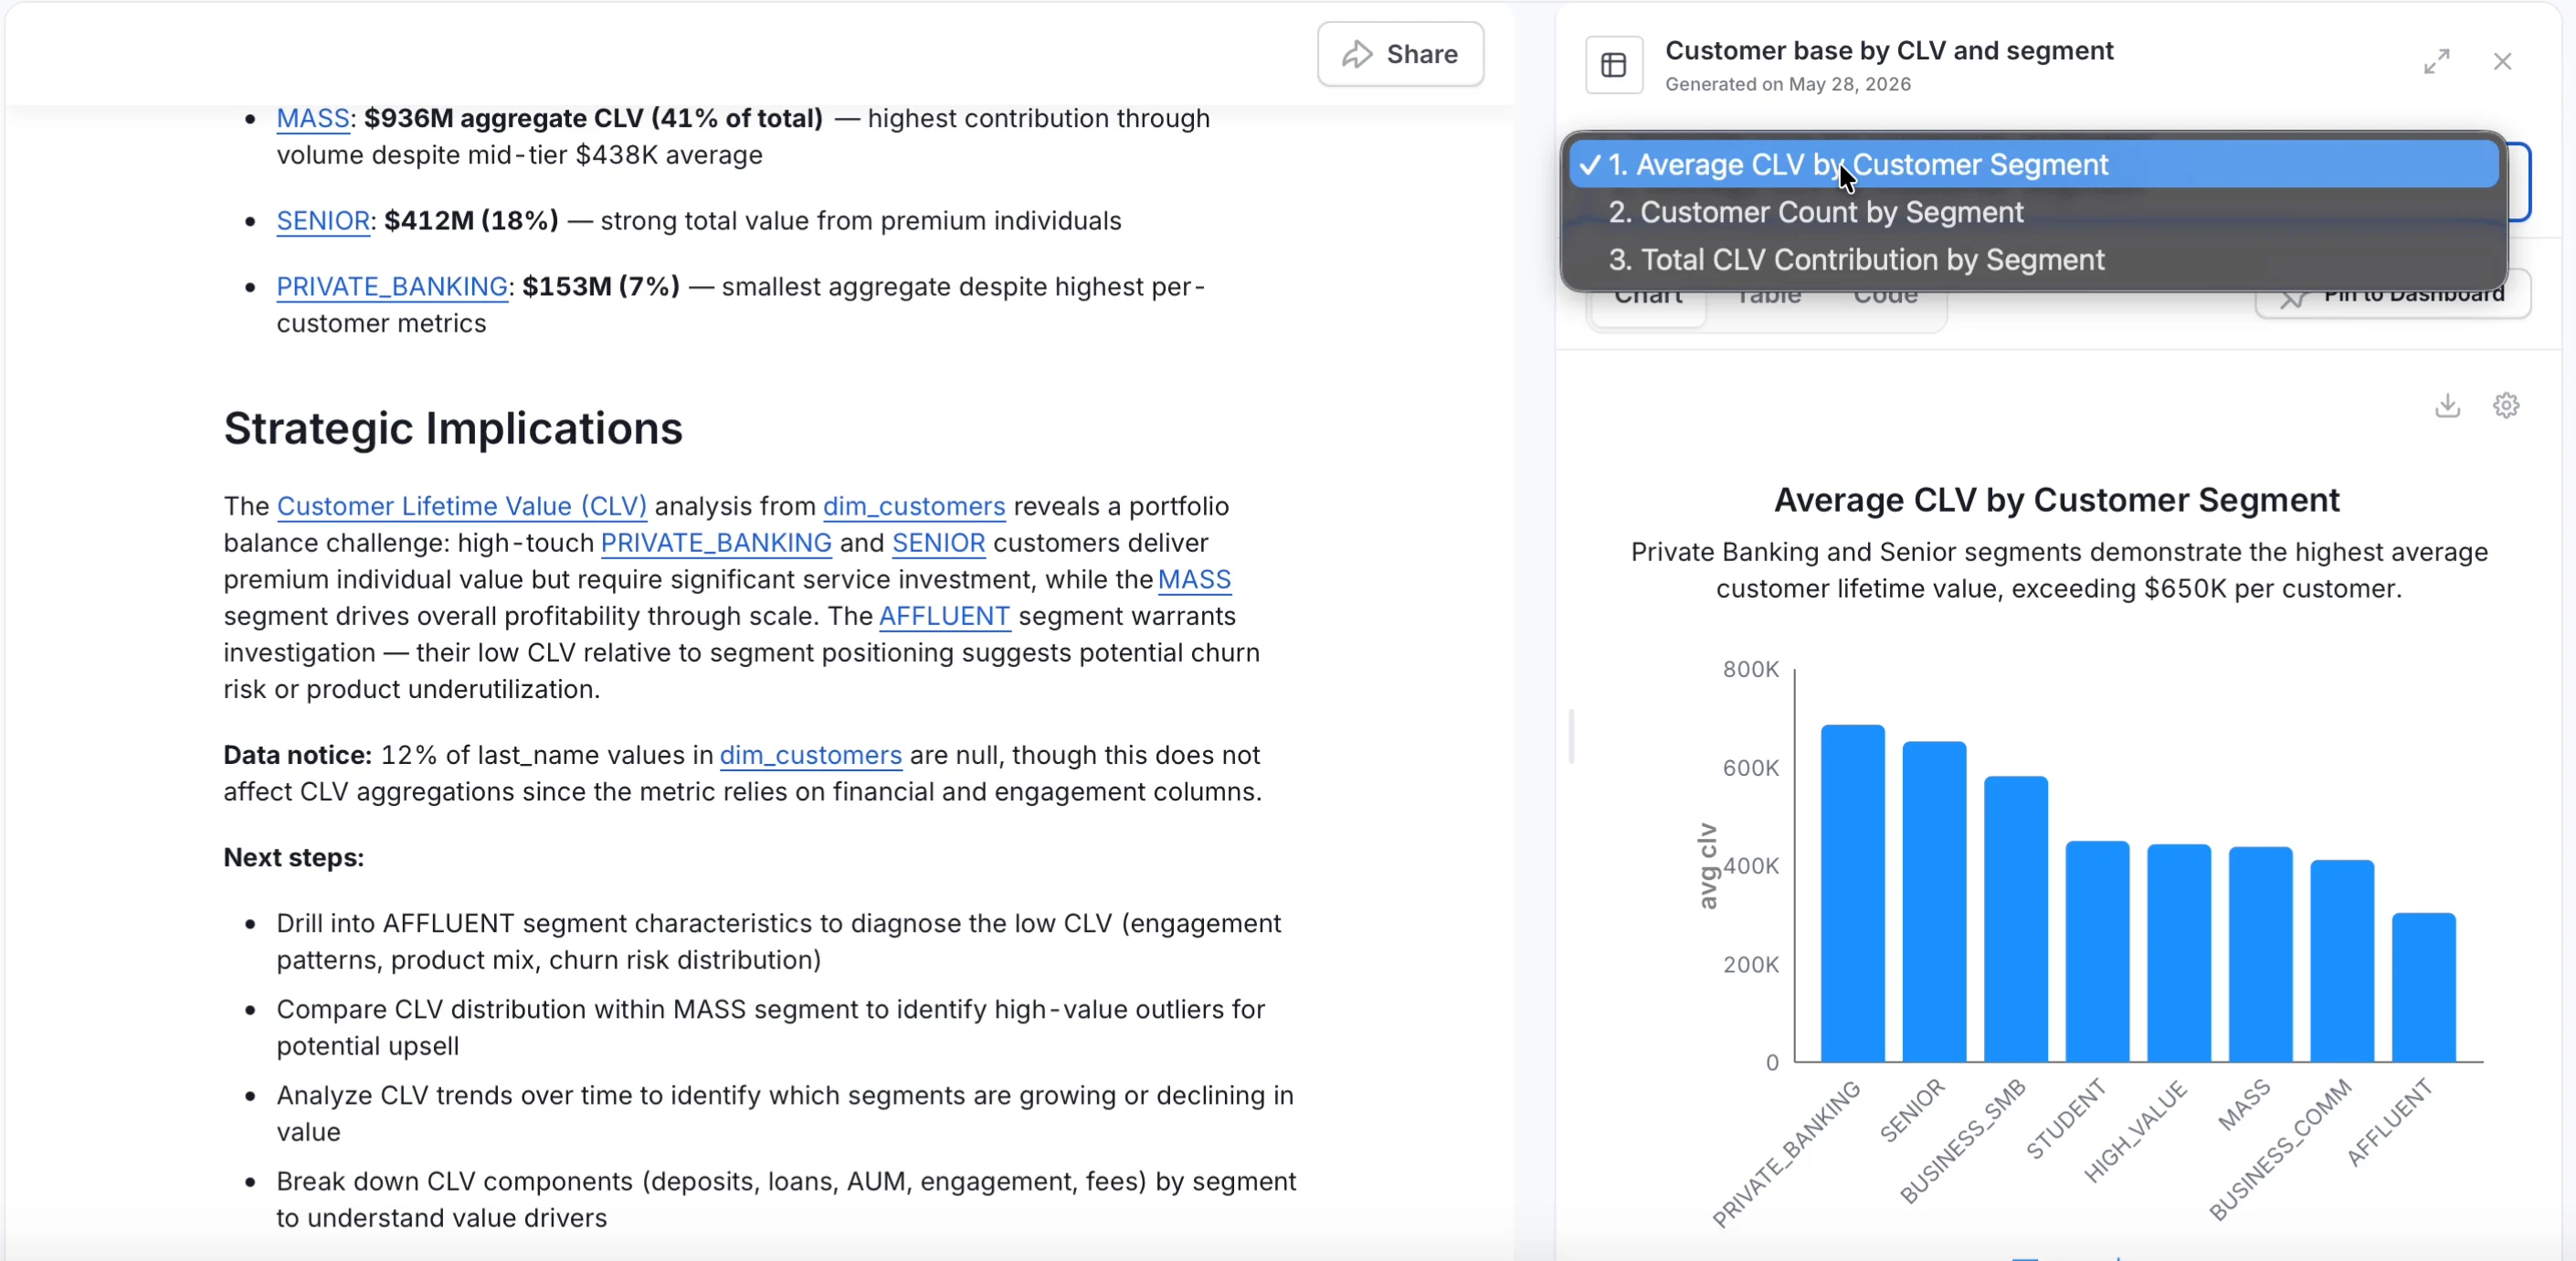
- What happens: An analyst shares their Collate AI conversation with a colleague — for example, a CFO who wants to take a strategic view of the same data.
- Result: The colleague opens the shared chat and sees the exact same charts, SQL queries, and reasoning — not just a screenshot. They can verify the logic and trust the numbers without starting from scratch.
- Ask: “Show me the top 20 retail customers by lifetime value who don’t hold a lending product — show them in a graph.”
- Result: Returns a chart of the top 20 customers, a summary of key patterns, and suggested next steps. The CLV computation stays consistent because it draws from the same knowledge graph definition, not one person’s session context.
Explore AI Chart
Each chart generated after querying Collate AI displays the following options:-
Data View — Each chart card has three tabs that let you look at your result in different ways:
- Chart — The default view. Collate AI picks the best chart type for your question — bar, line, pie, donut, or a summary card — but you can adjust the axes and groupings using the settings on the chart.
- Table — The same data laid out as rows and columns. Use this to spot-check numbers, sort by a column, search for a specific value, or copy data out.
- Code — The SQL query Collate AI ran to produce the result. Use this to verify the logic, hand it off to a data engineer, or run it directly in your query tool. The tab shows a status indicator so you can see whether the query is still running or has completed.
-
Chart Selector — Collate AI can tackle complex questions with multiple charts — each one is a different view or breakdown of your answer. Use the dropdown at the top of the side panel to switch between them.
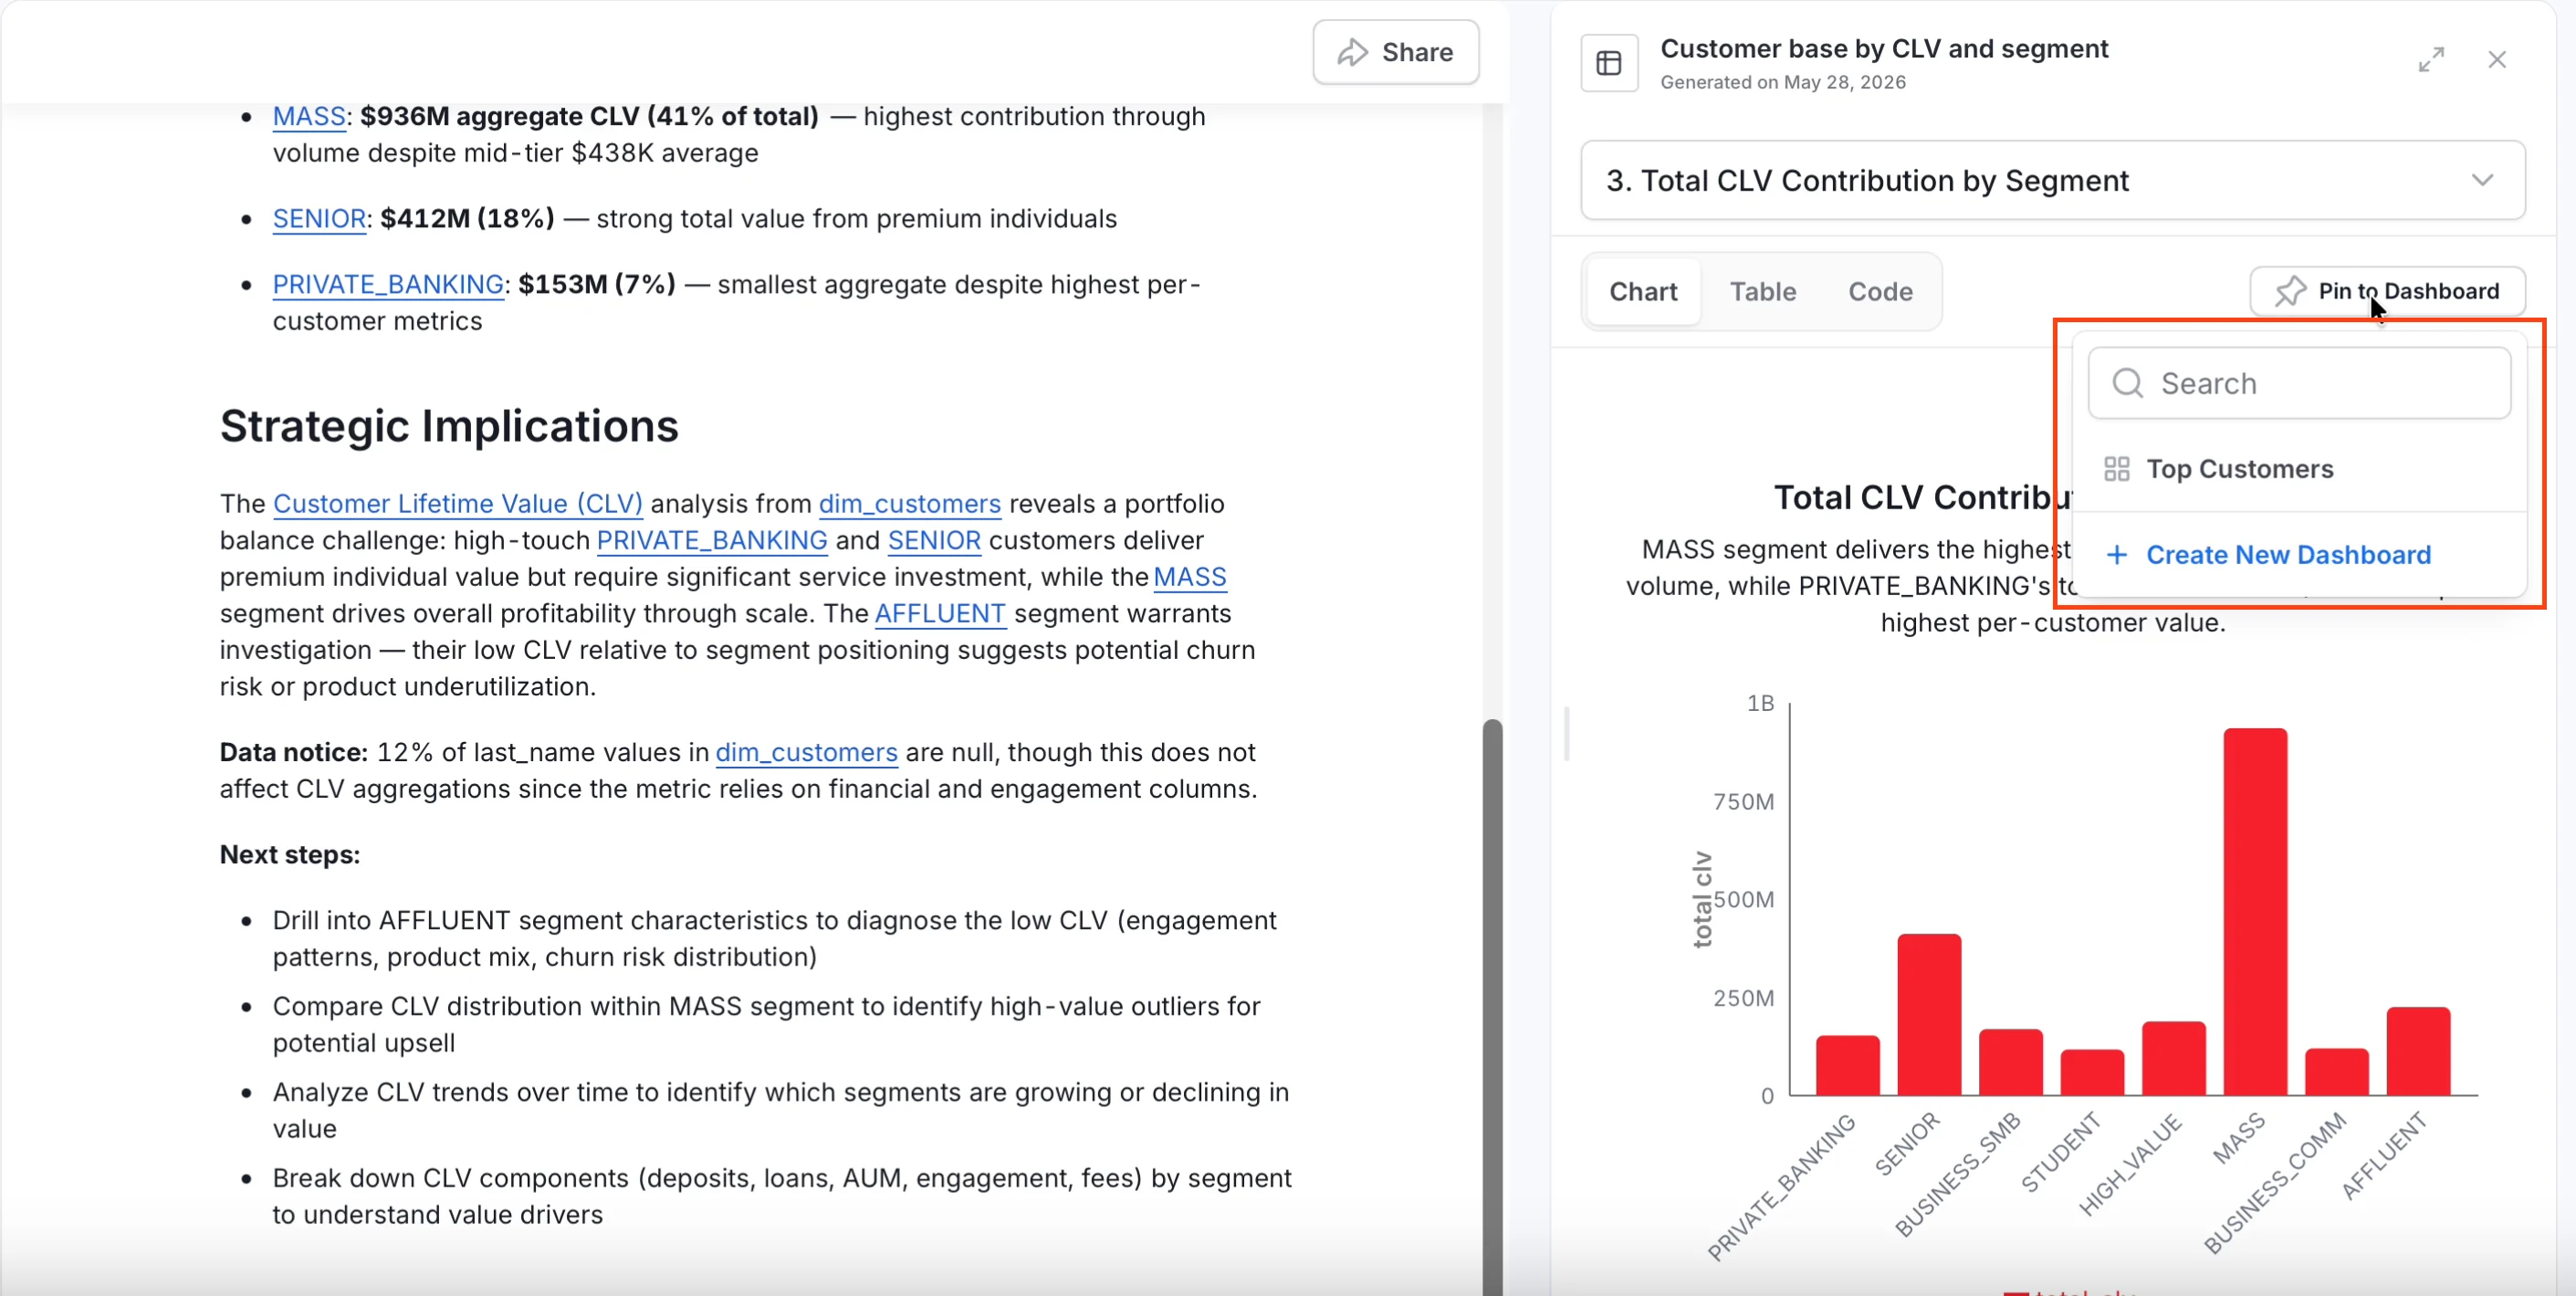
- Pin to Dashboard — Save a chart to a dashboard so you can find it later and share it with your team. See Pin a Chart to a Dashboard for steps.
- Download — Export a chart as an image or download the data behind it as a spreadsheet. See Export a Chart or Dashboard for steps.
Pin, Share, Export, and Schedule AI Insights
Charts that Collate AI generates stay with the conversation where they were created, so you can return to them later in that same chat. Pinning adds a chart to a dashboard so it is easier to find, organize, refresh, and share outside the conversation flow. A dashboard is a collection of pinned charts that you build up over time from any conversation.Pin a Chart to a Dashboard
- Ask Collate AI a question. Charts appear in the conversation as it works through your question.
- On a chart you want to keep, click Pin to dashboard.
- Choose an existing dashboard or create a new one. Use the search box to find a dashboard by name quickly.
- Open the dashboard to see all your pinned charts in one place and share it with your team.
Export a Chart or Dashboard
Save charts as images or download the data behind them as a spreadsheet. To export a single chart:- On the chart card, click the Download icon.
- Choose Export as PNG to save the chart as an image, or Export as CSV to download the data as a spreadsheet.
- Open the dashboard.
- Click the Download icon.
- Choose Save as PNG to save the whole dashboard as an image, or Save as CSV to download all the data in one file.
Share a Chat
- Open the conversation with the charts and context you want to share.
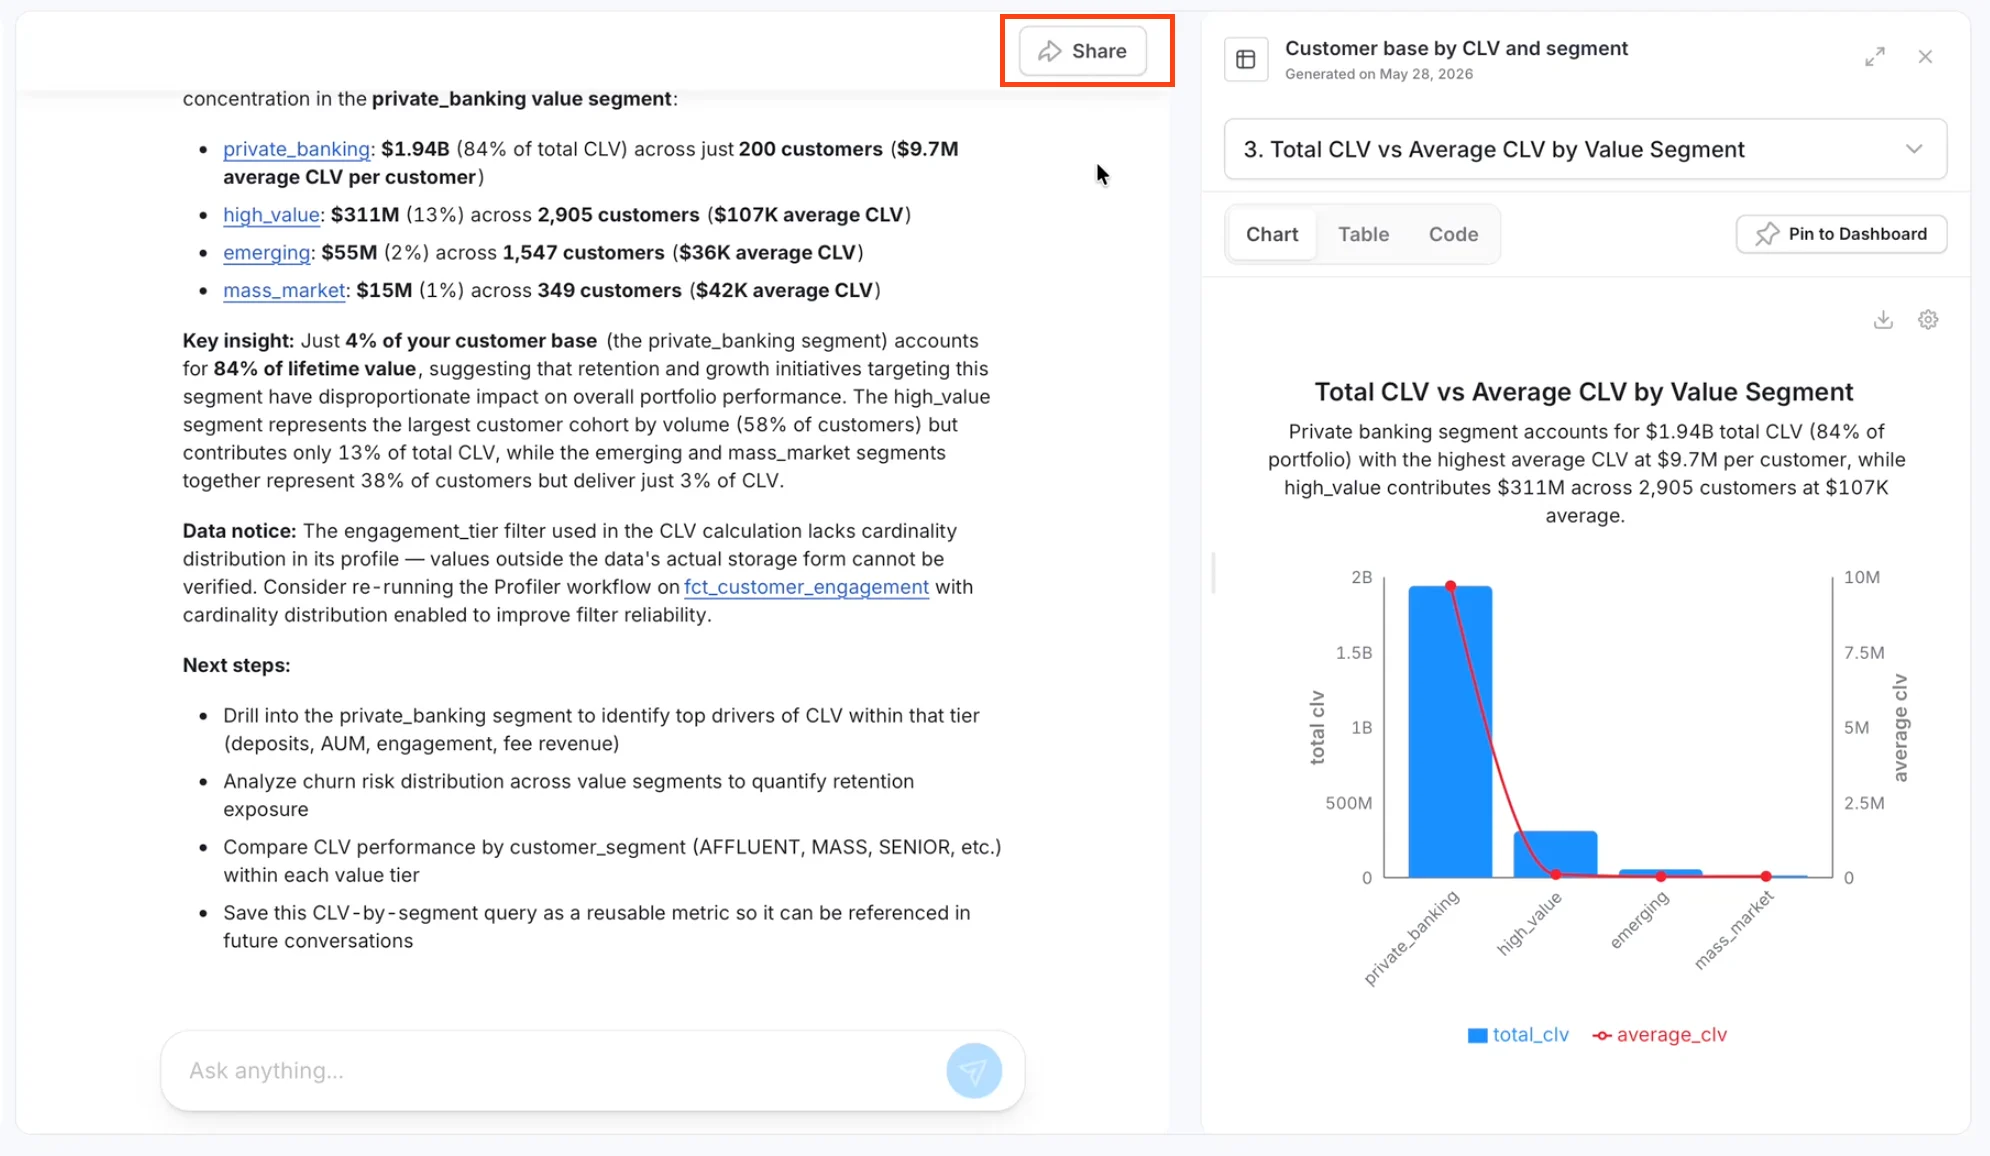
- Click Share on the conversation.
- Enter the email addresses or user groups and click Invite.
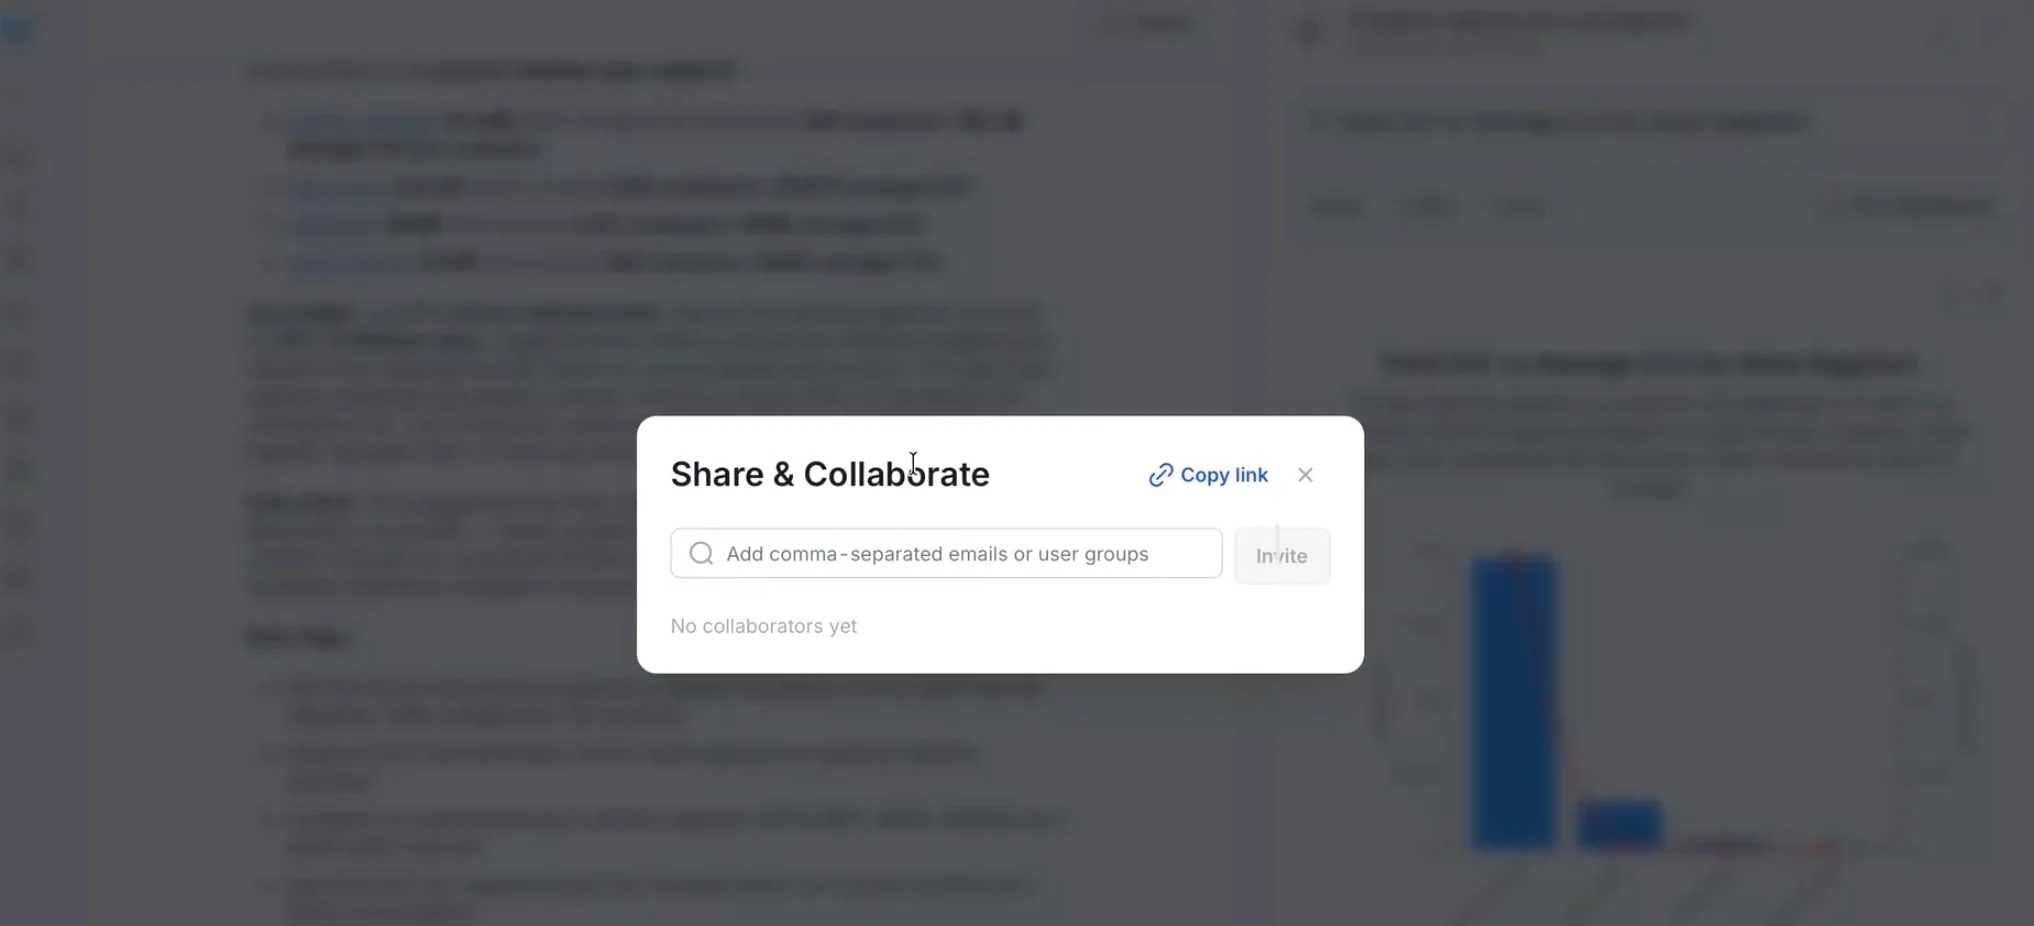
- Your teammate opens the shared chat and sees the same charts and context. They can ask follow-up questions and continue the analysis from where you left off.
Schedule a Report by Email
- Ask Collate AI a question and get the chart or insight you want to track.
- In the same conversation, ask Collate AI to create an automation — for example: “Create an automation that sends this report to my inbox every Sunday.”
- Collate AI sets up the automation and confirms the schedule.
- Open Automations in the navigation to review, edit, or trigger the report manually at any time.
Best Practices
- Be specific about what you want to see — mention the time range, group, or breakdown you’re after. The more specific you are, the better the first result.
- Pin charts as you go so useful AI insights are easier to find than scrolling back through conversation history.
- Share the conversation when a teammate needs to dig deeper — they get the full picture, not just a screenshot.
- If a number looks off, ask Collate AI to explain where it came from. Each chart links back to the data and logic behind it.
Troubleshooting
- Can’t access a dataset? Check that your access request was approved on the Marketplace page.
- Numbers look wrong? Every chart includes the query, raw results, and reasoning steps — check those first, or work with your data team to confirm definitions are correct.
- Answers seem incomplete? Your data connections may need to be refreshed. Check with your admin that data is being synced regularly.
- Getting inconsistent results? Try being more specific — mention the exact dataset, metric name, or time range. For deeper improvements, use Collate AI to create metrics with agreed-upon definitions, business glossary terms, or enriched column descriptions — this gives Collate AI the context it needs to return accurate, consistent answers.