> ## Documentation Index
> Fetch the complete documentation index at: https://docs.getcollate.io/llms.txt
> Use this file to discover all available pages before exploring further.
# Explore the Lineage View
> Explore lineage diagrams interactively to understand how data flows between sources, transformations, and dashboards.
# Explore the Lineage View
Collate displays end-to-end lineage for the table and column levels, for Database, Dashboard, and Pipeline assets. Search for a data asset and expand the graph to see its lineage:
* Each node expands to show its upstream and downstream edges.
* Each edge carries details such as the SQL query, pipeline information, and column-level lineage.
## Source, Target, and Edges
In the example below:
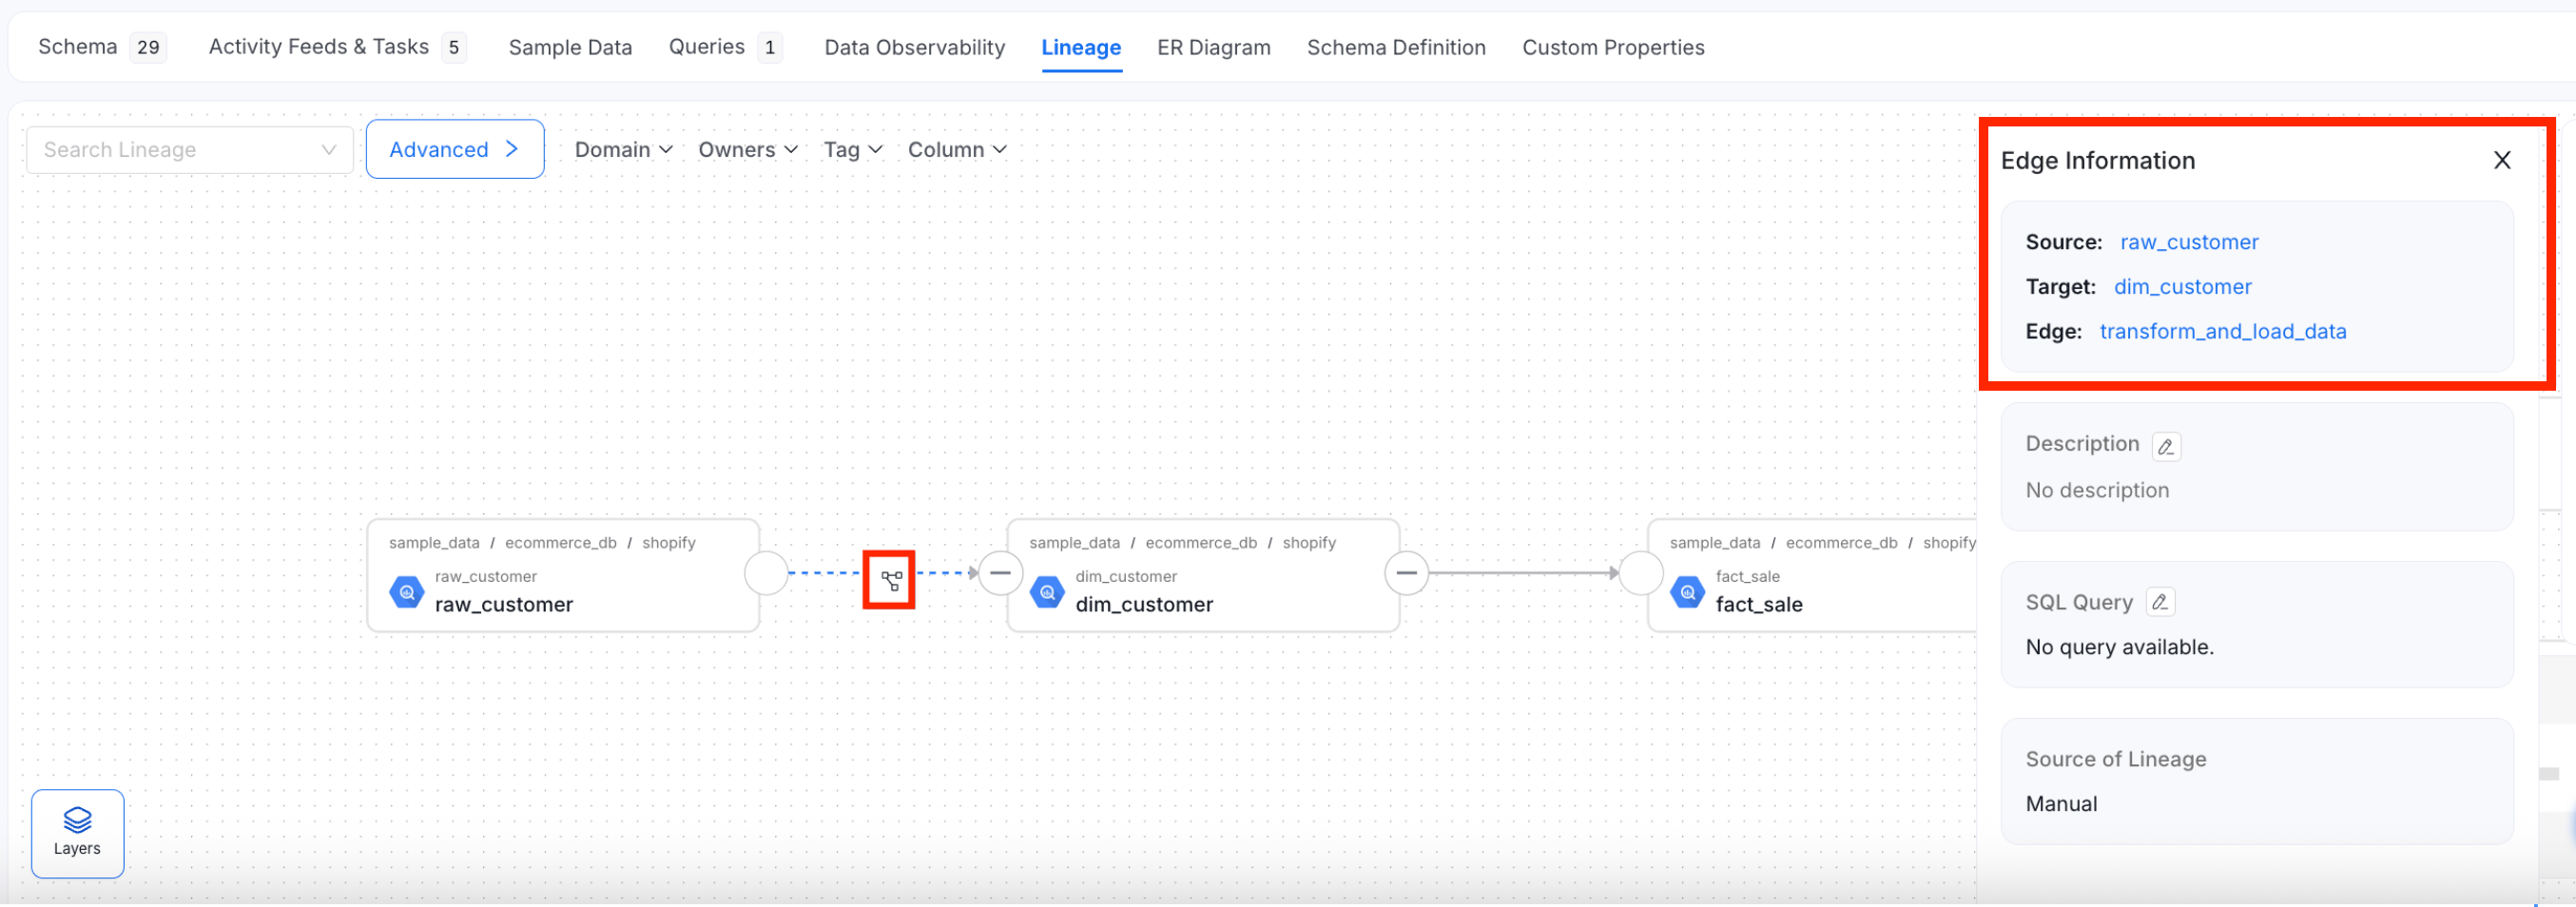
* The table on the left is the parent, or **Source** node.
* The table on the right is the **Target** node, identifiable by the arrow pointing into it.
* The arrow connecting them is the **Edge**.
Click an edge to see its details: the Source, Target, Description, and SQL Query. For a view, the SQL query shows how the target was generated from the source.
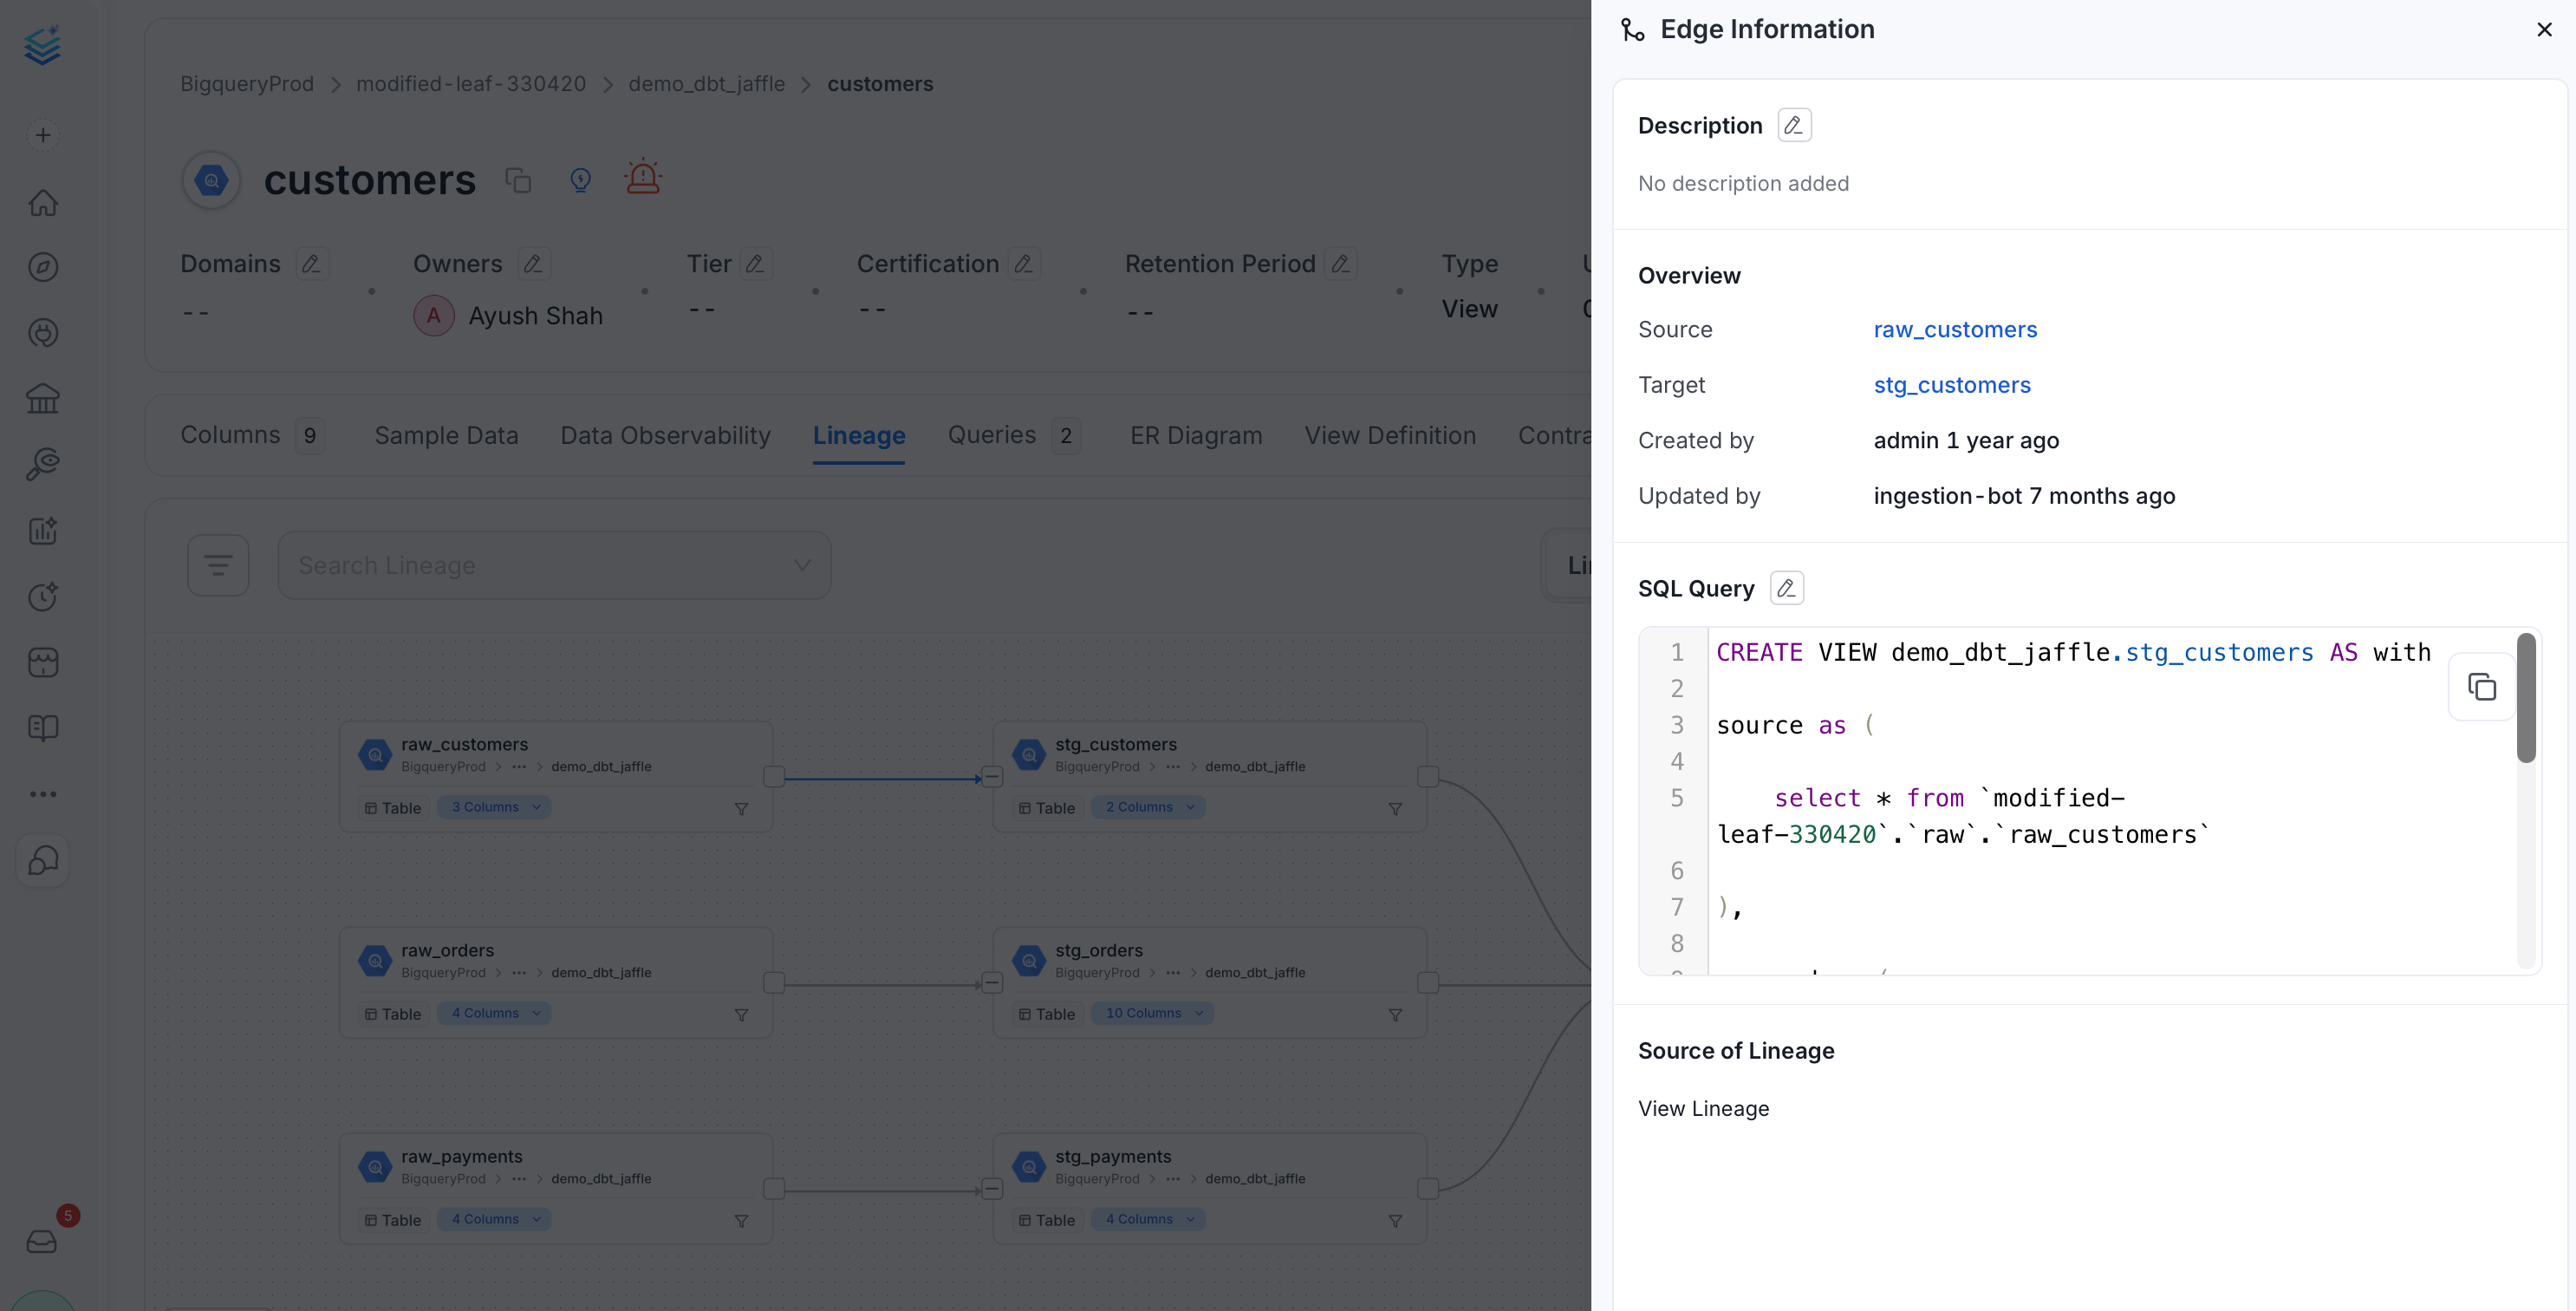 Metadata ingestion also brings in view lineage, if the database has views (data assets of the type View).
## Lineage Config
Control how many upstream and downstream nodes appear in the graph. This only affects your current view: it resets to the platform default the next time you open a lineage graph.
To configure the lineage nodes, follow the steps below:
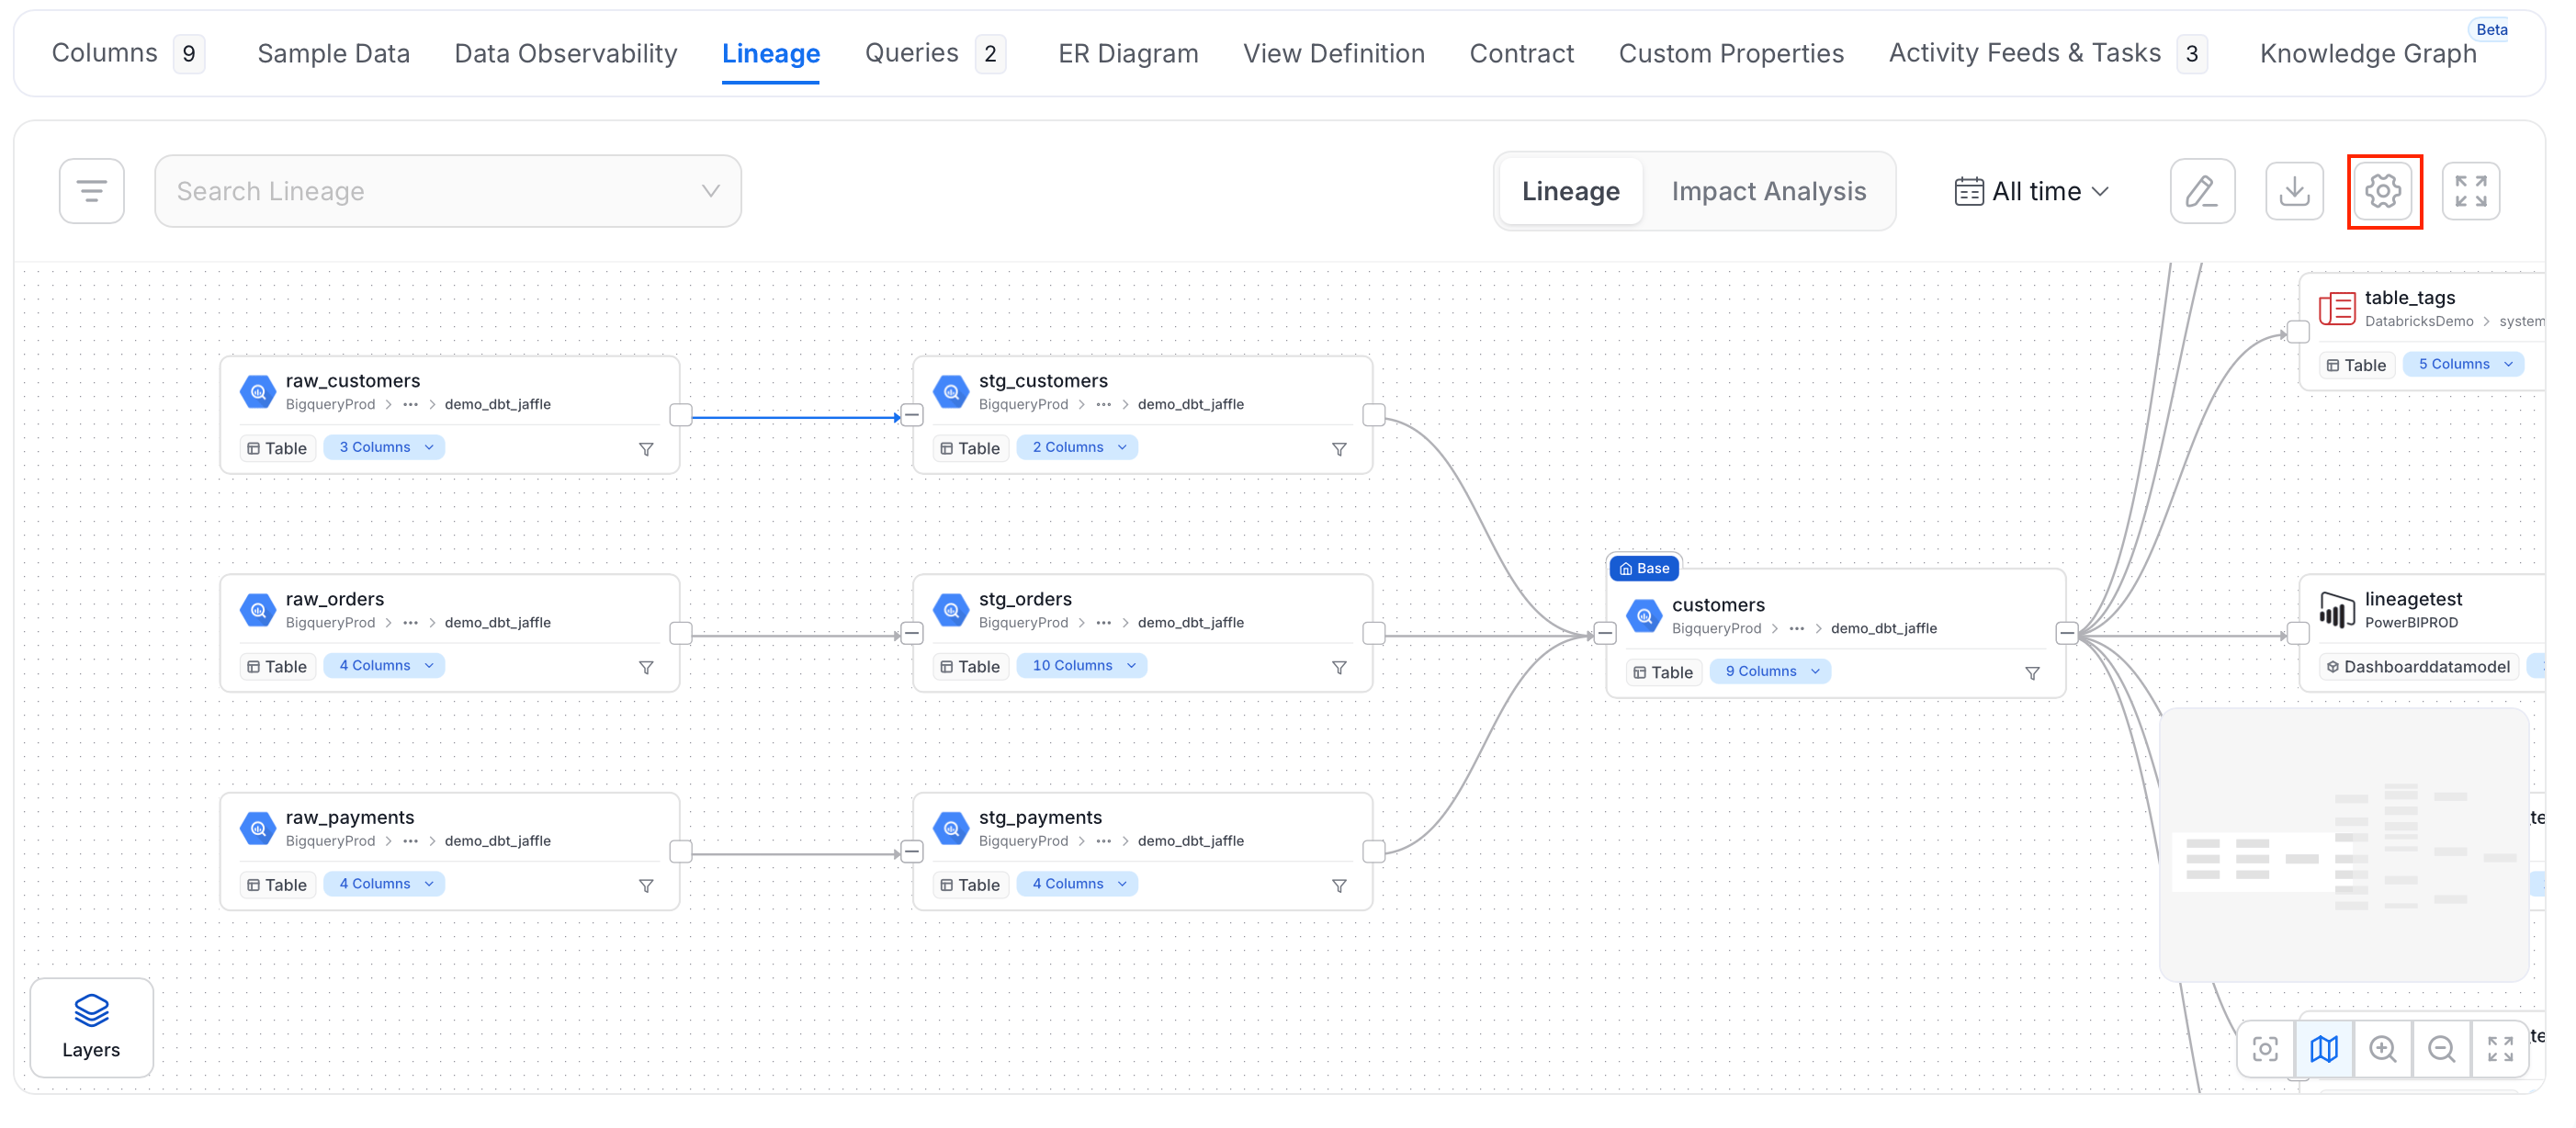
1. Click the **Setting** icon.
Metadata ingestion also brings in view lineage, if the database has views (data assets of the type View).
## Lineage Config
Control how many upstream and downstream nodes appear in the graph. This only affects your current view: it resets to the platform default the next time you open a lineage graph.
To configure the lineage nodes, follow the steps below:
1. Click the **Setting** icon.
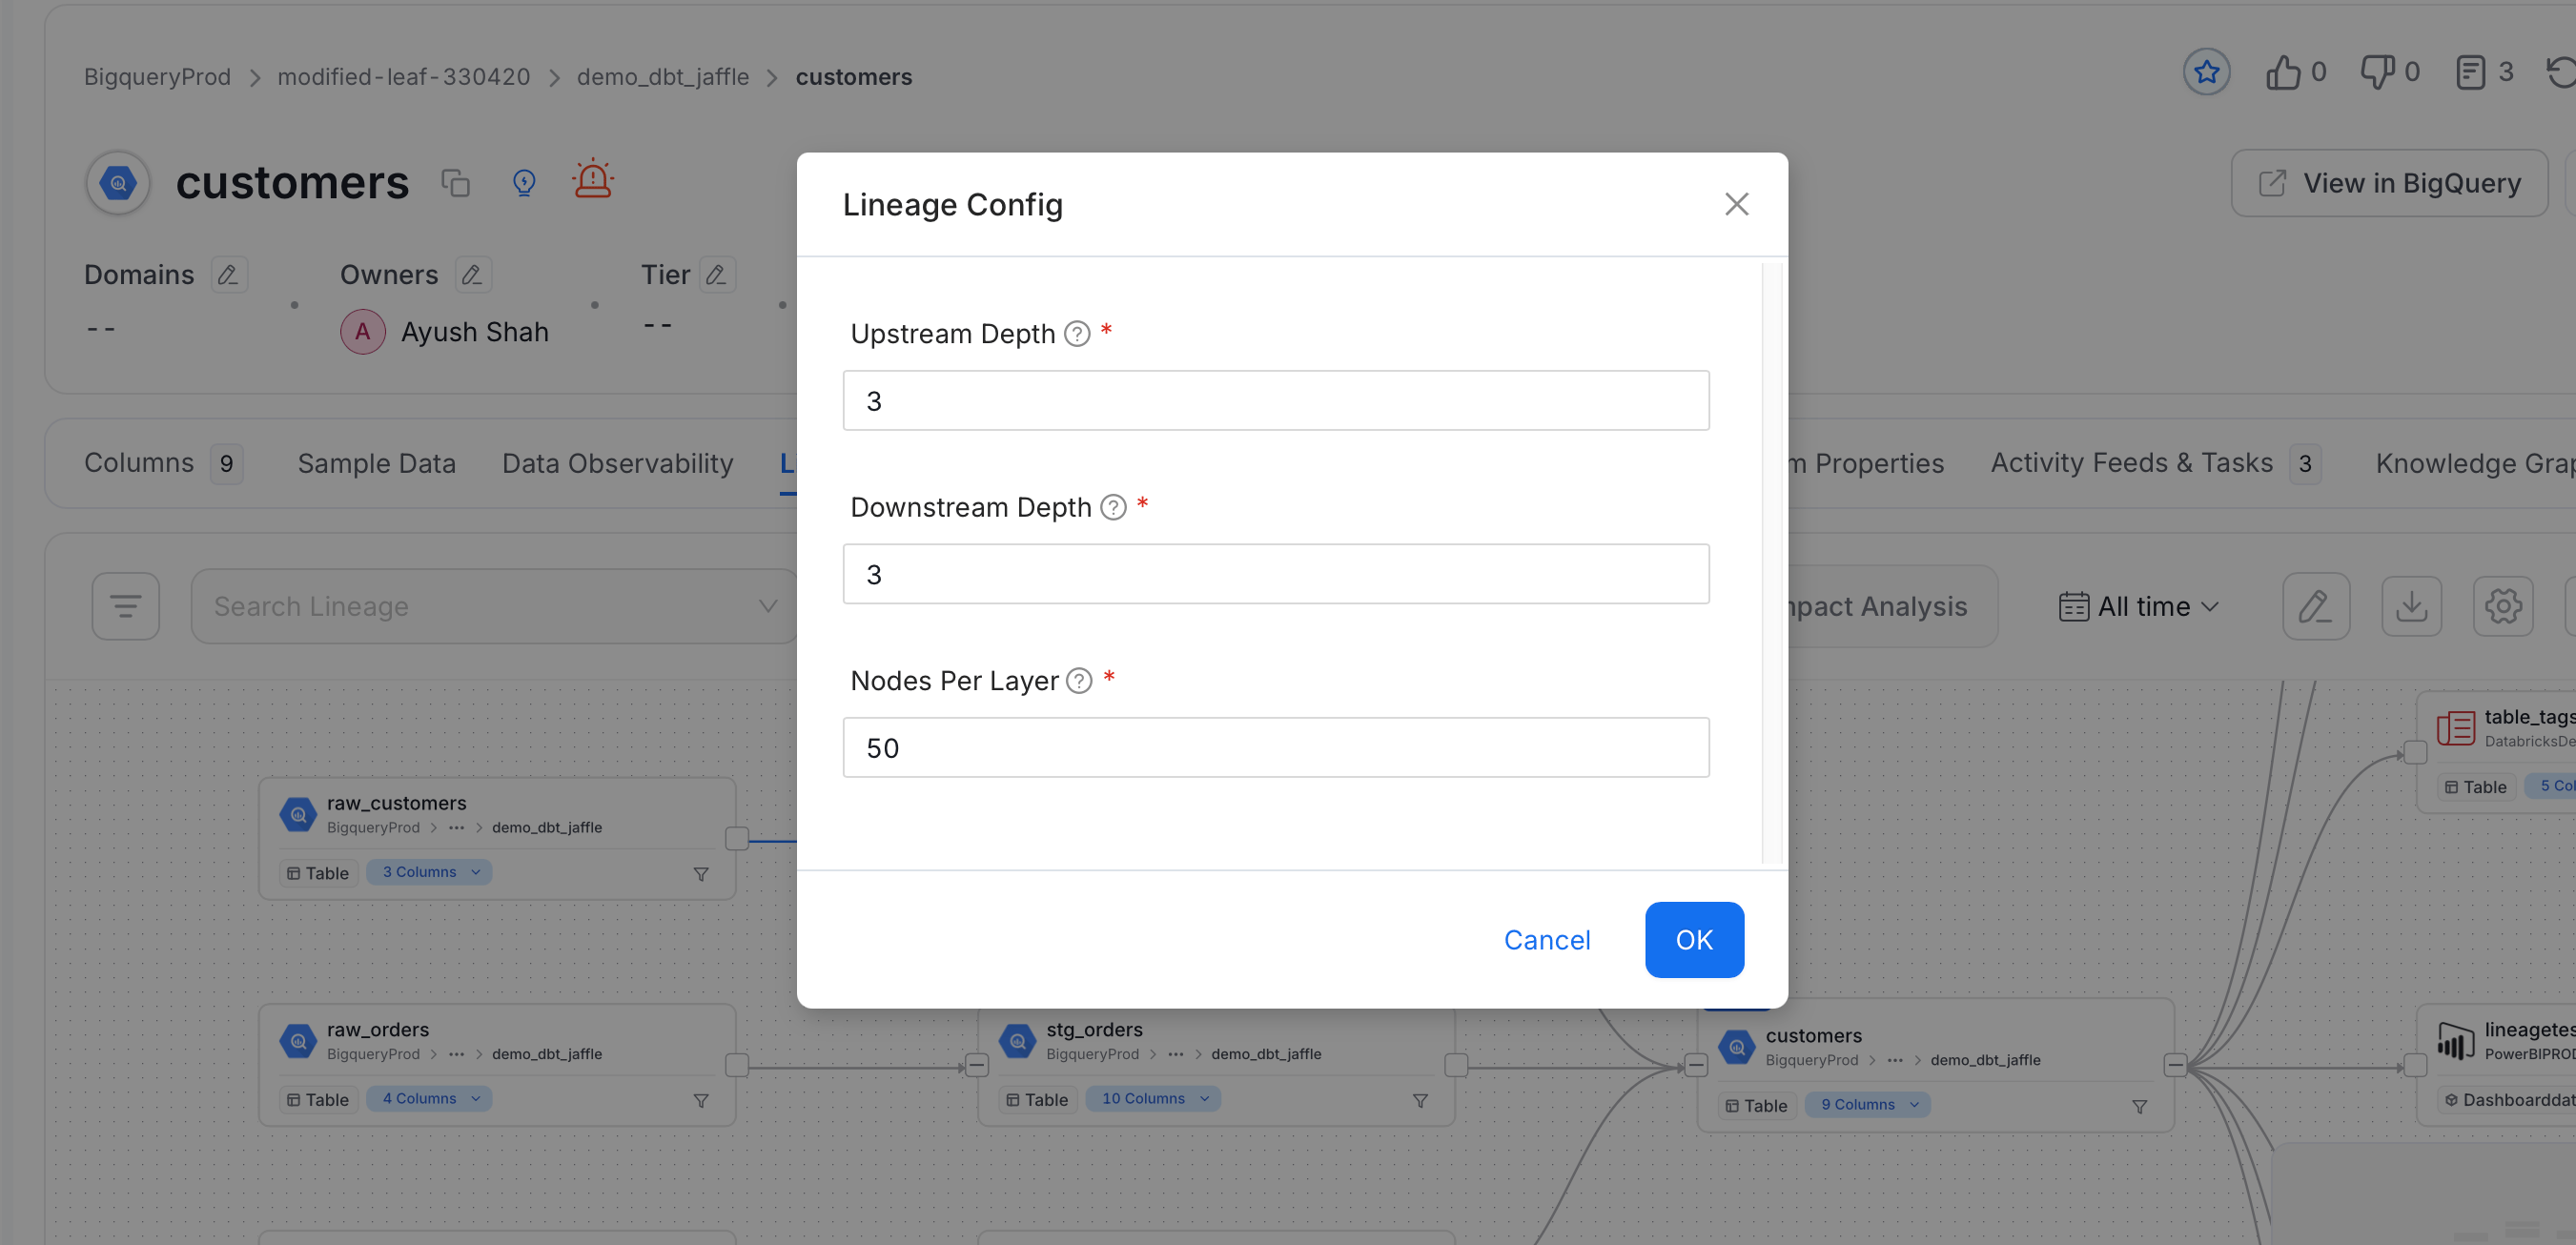
 2. Set the following fields:
* **Upstream Depth**: Number of upstream hops shown by default when opening a lineage graph, to identify parent-level sources.
* **Downstream Depth**: Number of downstream hops shown by default when opening a lineage graph, to identify child-level targets.
* **Nodes Per Layer**: Maximum number of nodes shown per layer. There's no fixed maximum here. If a layer has more nodes than this, the rest are paginated instead of all being rendered at once.
2. Set the following fields:
* **Upstream Depth**: Number of upstream hops shown by default when opening a lineage graph, to identify parent-level sources.
* **Downstream Depth**: Number of downstream hops shown by default when opening a lineage graph, to identify child-level targets.
* **Nodes Per Layer**: Maximum number of nodes shown per layer. There's no fixed maximum here. If a layer has more nodes than this, the rest are paginated instead of all being rendered at once.
 To change the default that applies for every session, see [Lineage](/ai-2-0/admin-guide/preferences/lineage).
## Impact Analysis View
The Lineage page has two tabs at the top: **Lineage** (the graph you've seen so far) and **Impact Analysis**, a table that lists the same upstream and downstream assets as rows instead of nodes on a graph. This is easier to scan, search, and sort when an asset has a large number of dependencies.
To change the default that applies for every session, see [Lineage](/ai-2-0/admin-guide/preferences/lineage).
## Impact Analysis View
The Lineage page has two tabs at the top: **Lineage** (the graph you've seen so far) and **Impact Analysis**, a table that lists the same upstream and downstream assets as rows instead of nodes on a graph. This is easier to scan, search, and sort when an asset has a large number of dependencies.
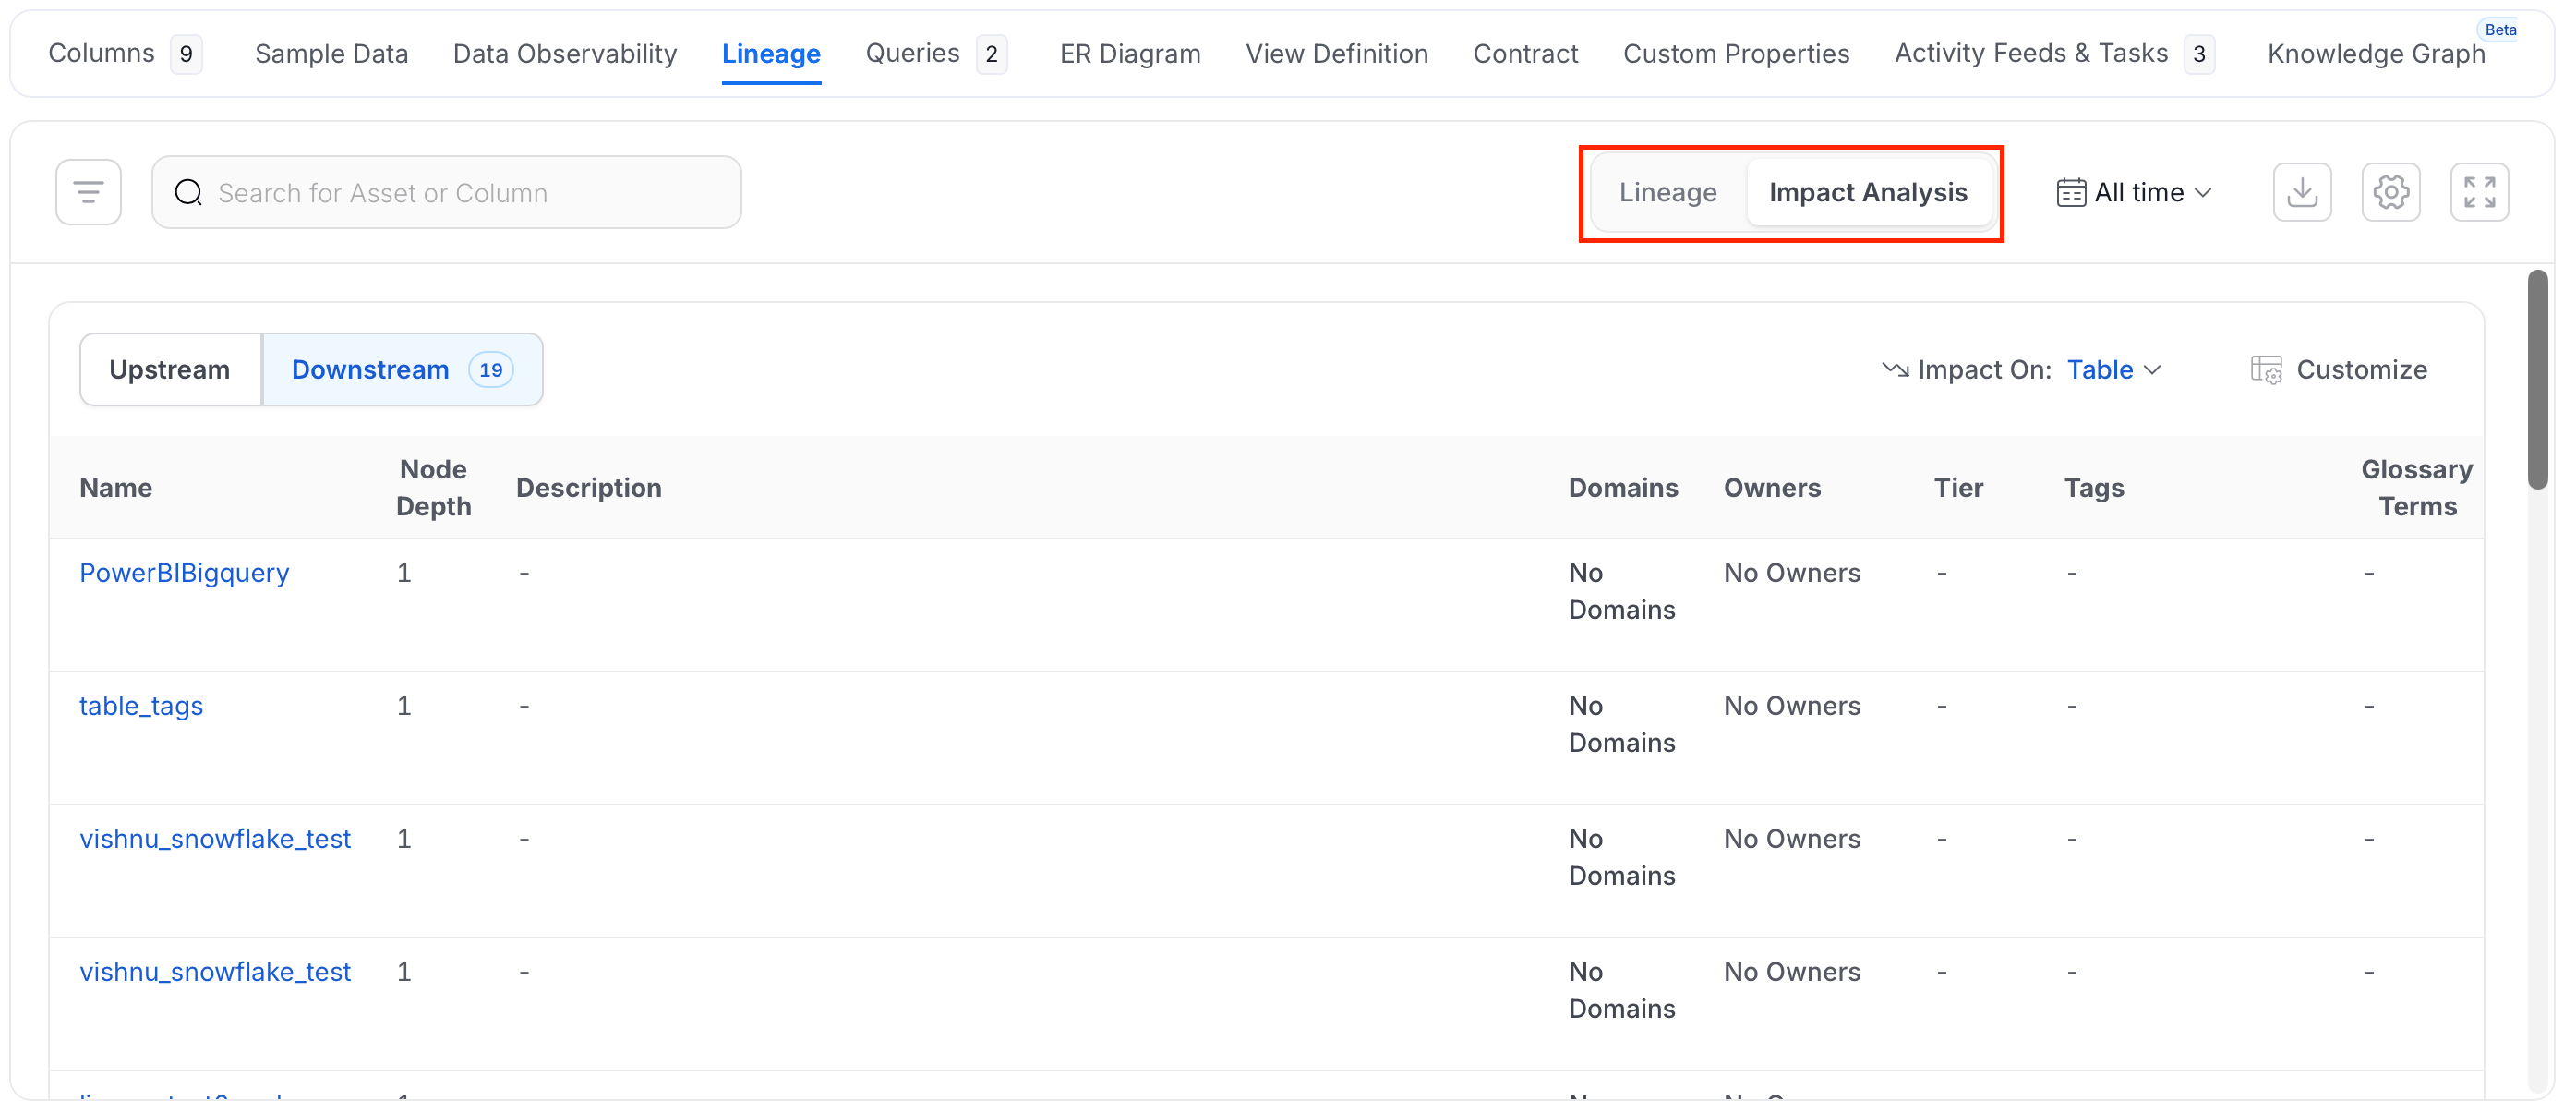 * **Upstream / Downstream**: Switch direction. Each option shows a count of how many assets lie in that direction.
* **Impact On**: Choose whether the table lists **Asset Level** impact (one row per table, pipeline, dashboard, and so on) or **Column Level** impact (one row per source-to-target column mapping).
* **Customize**: Choose which columns to show. Name (or Source/Impacted Column, in Column Level mode) always stays visible. Every other column can be toggled off.
Search narrows the rows by asset name (Asset Level) or column name (Column Level).
**Asset Level** columns: Name, Node Depth (number of hops from the asset you're viewing), Description, Domains, Owners, Tier, Tags, and Glossary Terms.
**Column Level** columns: Source, Source Column, Impacted (the downstream or upstream asset), Impacted Column, plus the same Node Depth, Description, Domains, Owners, Tier, Tags, and Glossary Terms columns.
## Data Asset Details
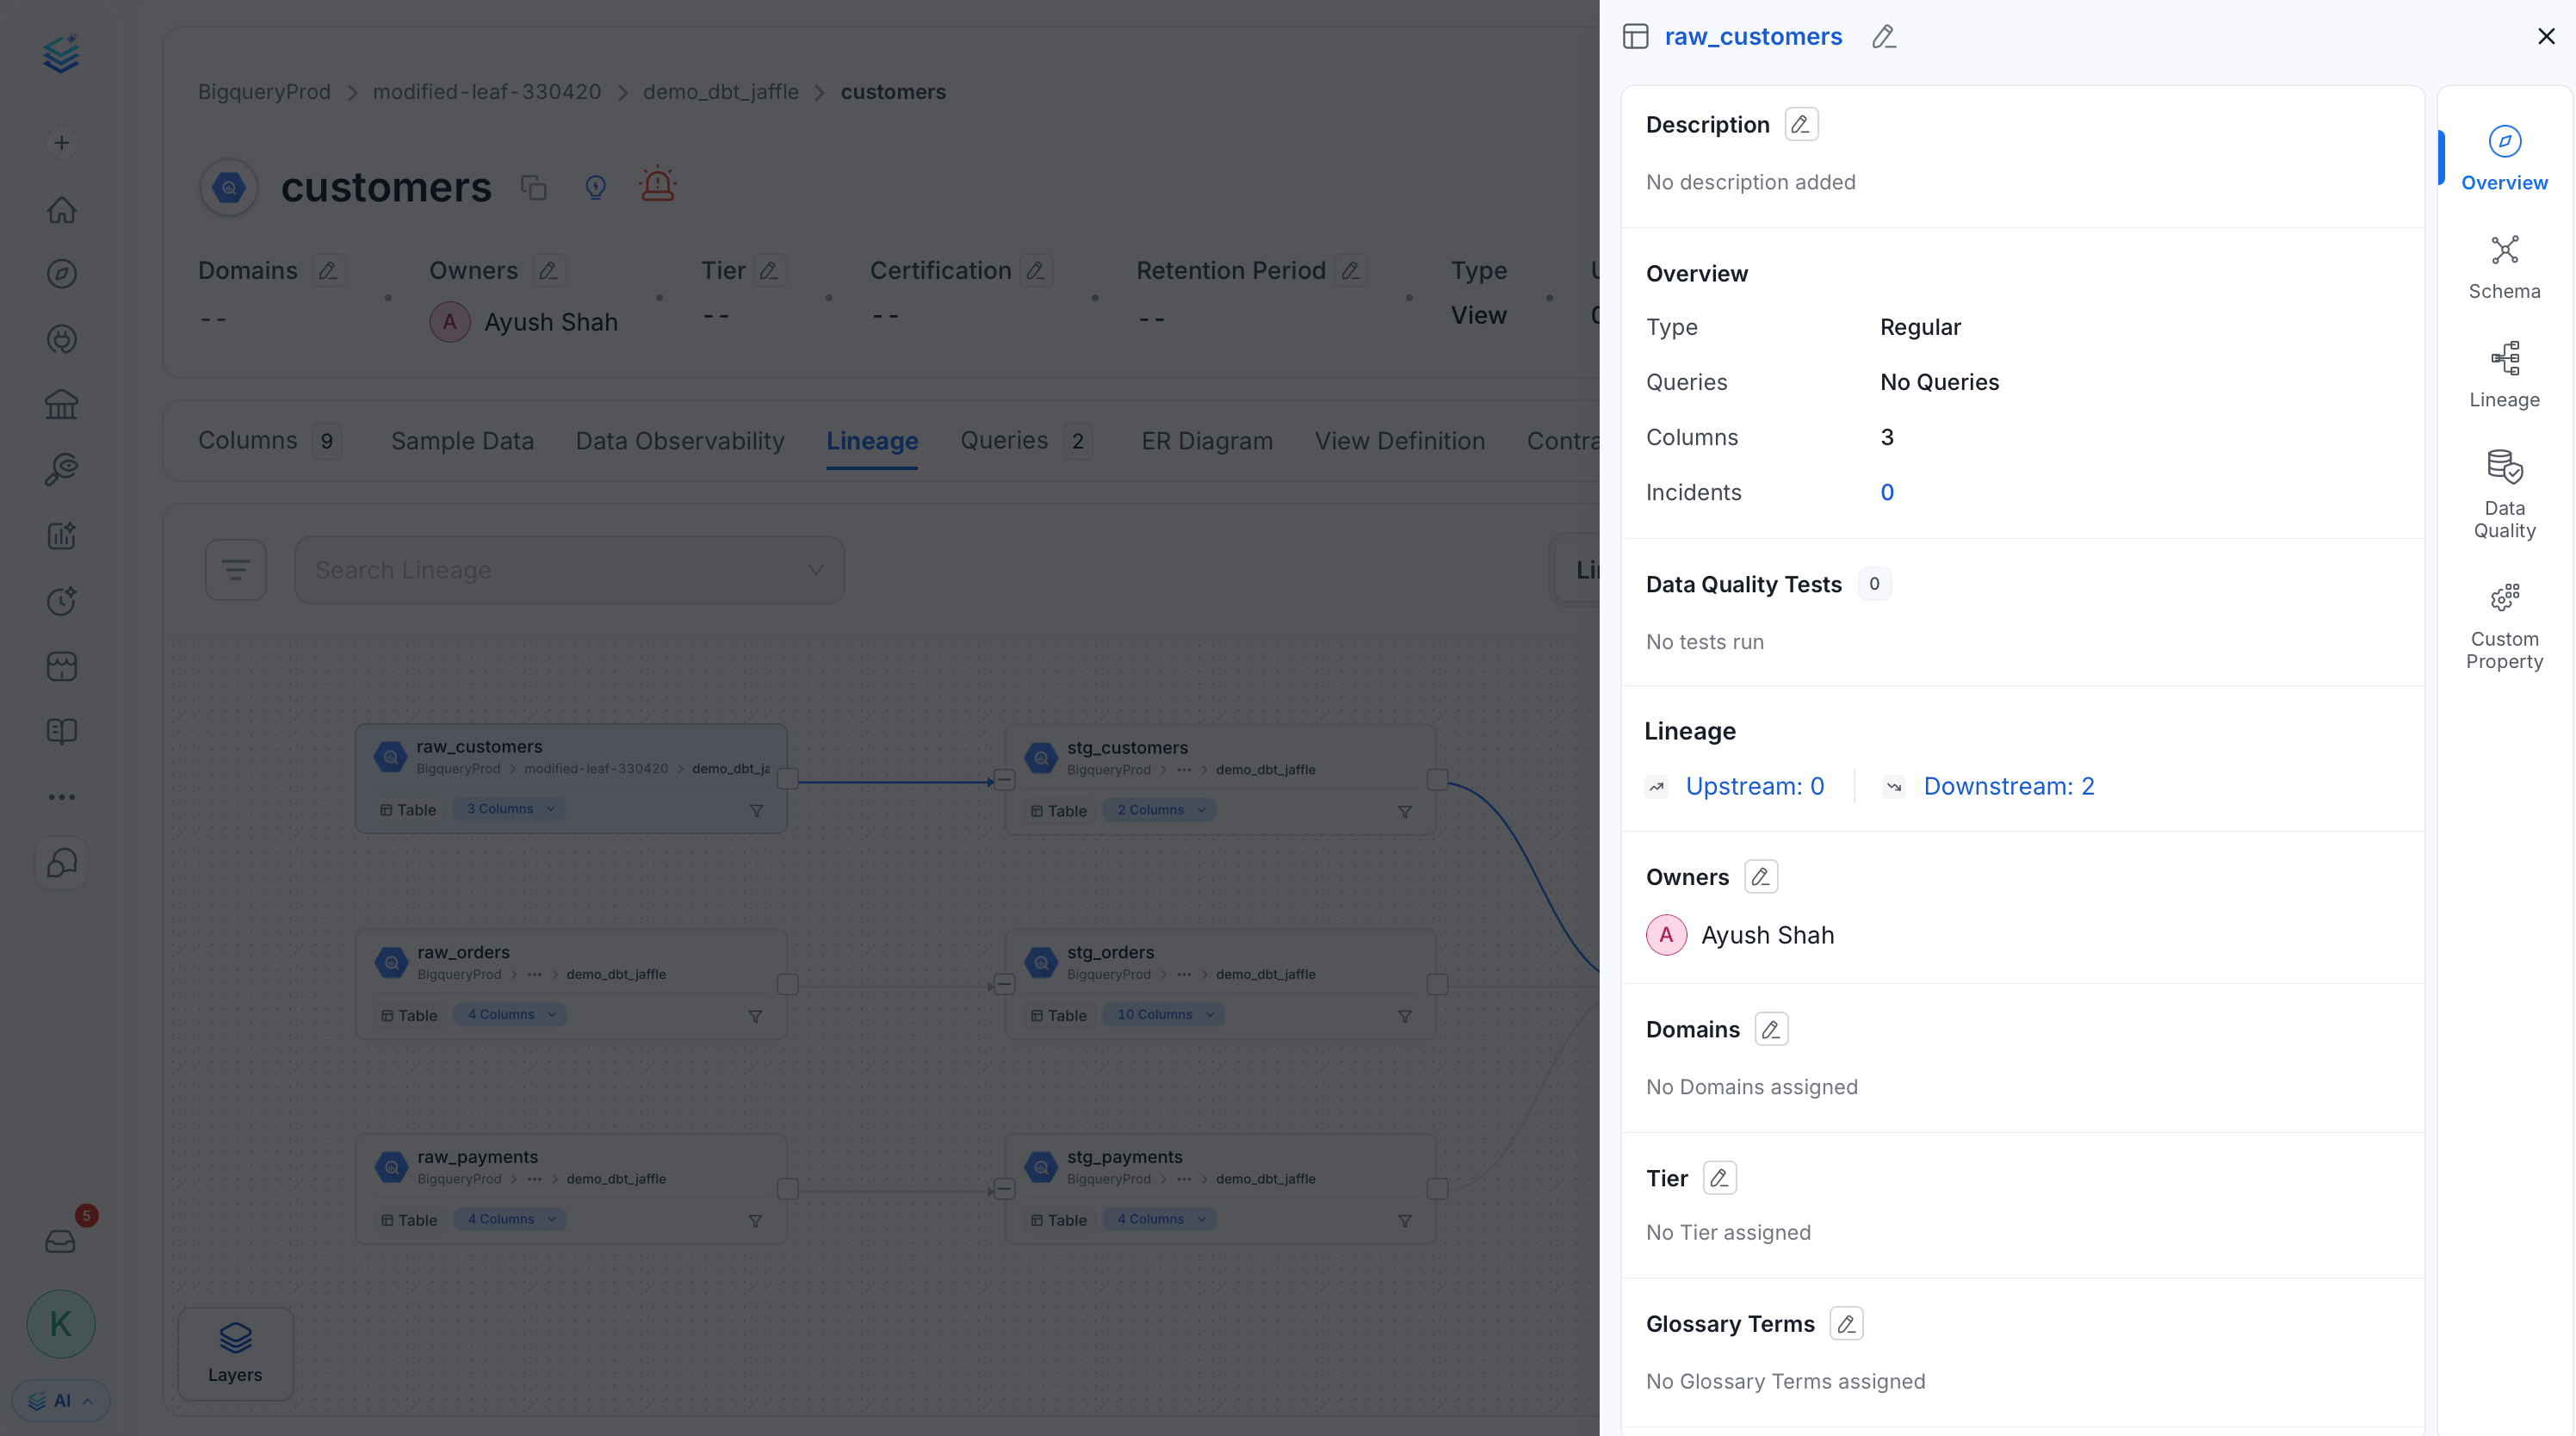
Click a data asset to view its details:
* **Source, Name, Description, Owner** (team/user), **Tier**, and **Usage** information.
* Additional details based on the **type of data asset** (Table, Topic, Dashboard, Pipeline, ML Model, Container). For example, a table's type, number of queries, and columns.
* **Data quality and profiler metrics**, including tests passed, aborted, and failed.
* **Tags** associated with the data asset.
* **Schema** details: column names, column types, and column descriptions.
* **Upstream / Downstream**: Switch direction. Each option shows a count of how many assets lie in that direction.
* **Impact On**: Choose whether the table lists **Asset Level** impact (one row per table, pipeline, dashboard, and so on) or **Column Level** impact (one row per source-to-target column mapping).
* **Customize**: Choose which columns to show. Name (or Source/Impacted Column, in Column Level mode) always stays visible. Every other column can be toggled off.
Search narrows the rows by asset name (Asset Level) or column name (Column Level).
**Asset Level** columns: Name, Node Depth (number of hops from the asset you're viewing), Description, Domains, Owners, Tier, Tags, and Glossary Terms.
**Column Level** columns: Source, Source Column, Impacted (the downstream or upstream asset), Impacted Column, plus the same Node Depth, Description, Domains, Owners, Tier, Tags, and Glossary Terms columns.
## Data Asset Details
Click a data asset to view its details:
* **Source, Name, Description, Owner** (team/user), **Tier**, and **Usage** information.
* Additional details based on the **type of data asset** (Table, Topic, Dashboard, Pipeline, ML Model, Container). For example, a table's type, number of queries, and columns.
* **Data quality and profiler metrics**, including tests passed, aborted, and failed.
* **Tags** associated with the data asset.
* **Schema** details: column names, column types, and column descriptions.
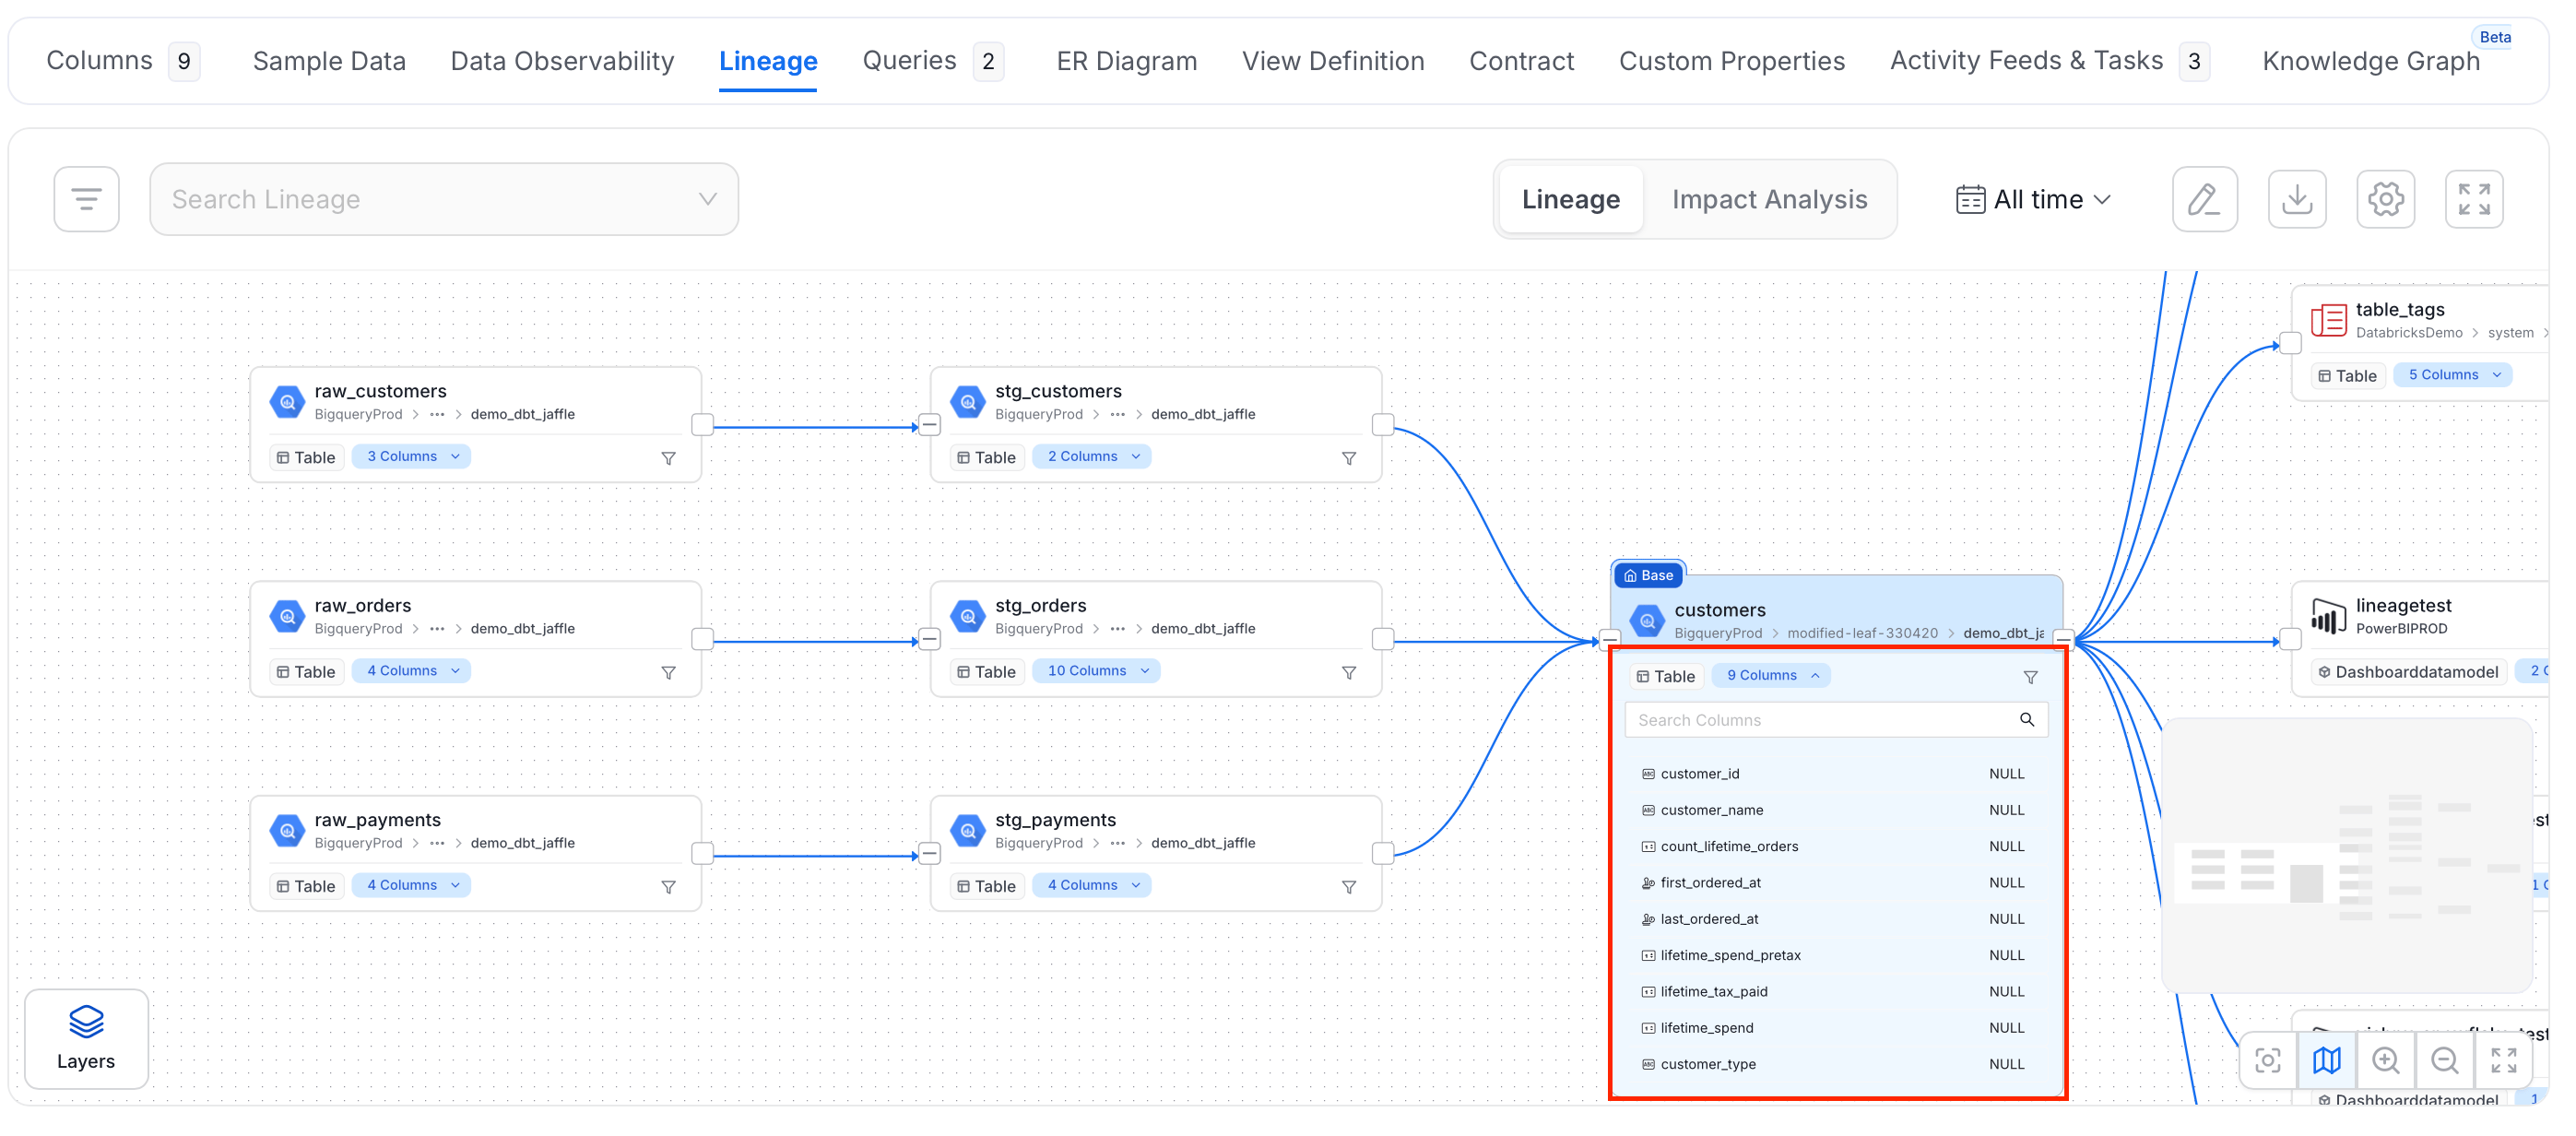
 ## Column-Level Lineage
Click a table to expand its list of columns and see column-level lineage.
## Column-Level Lineage
Click a table to expand its list of columns and see column-level lineage.
 ## Pipeline and Dashboard Lineage
For **Pipelines**:
* Lineage first comes from the metadata ingested from the databases.
* Setting up pipeline ingestion with a database service name links the pipeline to the database tables it reads from and writes to.
* If a pipeline creates the lineage, that shows up in the edge information too.
## Pipeline and Dashboard Lineage
For **Pipelines**:
* Lineage first comes from the metadata ingested from the databases.
* Setting up pipeline ingestion with a database service name links the pipeline to the database tables it reads from and writes to.
* If a pipeline creates the lineage, that shows up in the edge information too.
 **Dashboards** work the same way:
* Lineage first comes from the metadata ingested from the databases.
* Dashboard ingestion then adds the data models and charts, linking them back to the database tables they're built on.
## Lineage Layers
Switch between layers to explore different dimensions of your data's lineage.
### Column Layer
Trace individual fields — like `customer_id` or `first_name` — as they move across tables and pipelines. The column layer shows exactly how each attribute transforms along the way.
**Dashboards** work the same way:
* Lineage first comes from the metadata ingested from the databases.
* Dashboard ingestion then adds the data models and charts, linking them back to the database tables they're built on.
## Lineage Layers
Switch between layers to explore different dimensions of your data's lineage.
### Column Layer
Trace individual fields — like `customer_id` or `first_name` — as they move across tables and pipelines. The column layer shows exactly how each attribute transforms along the way.
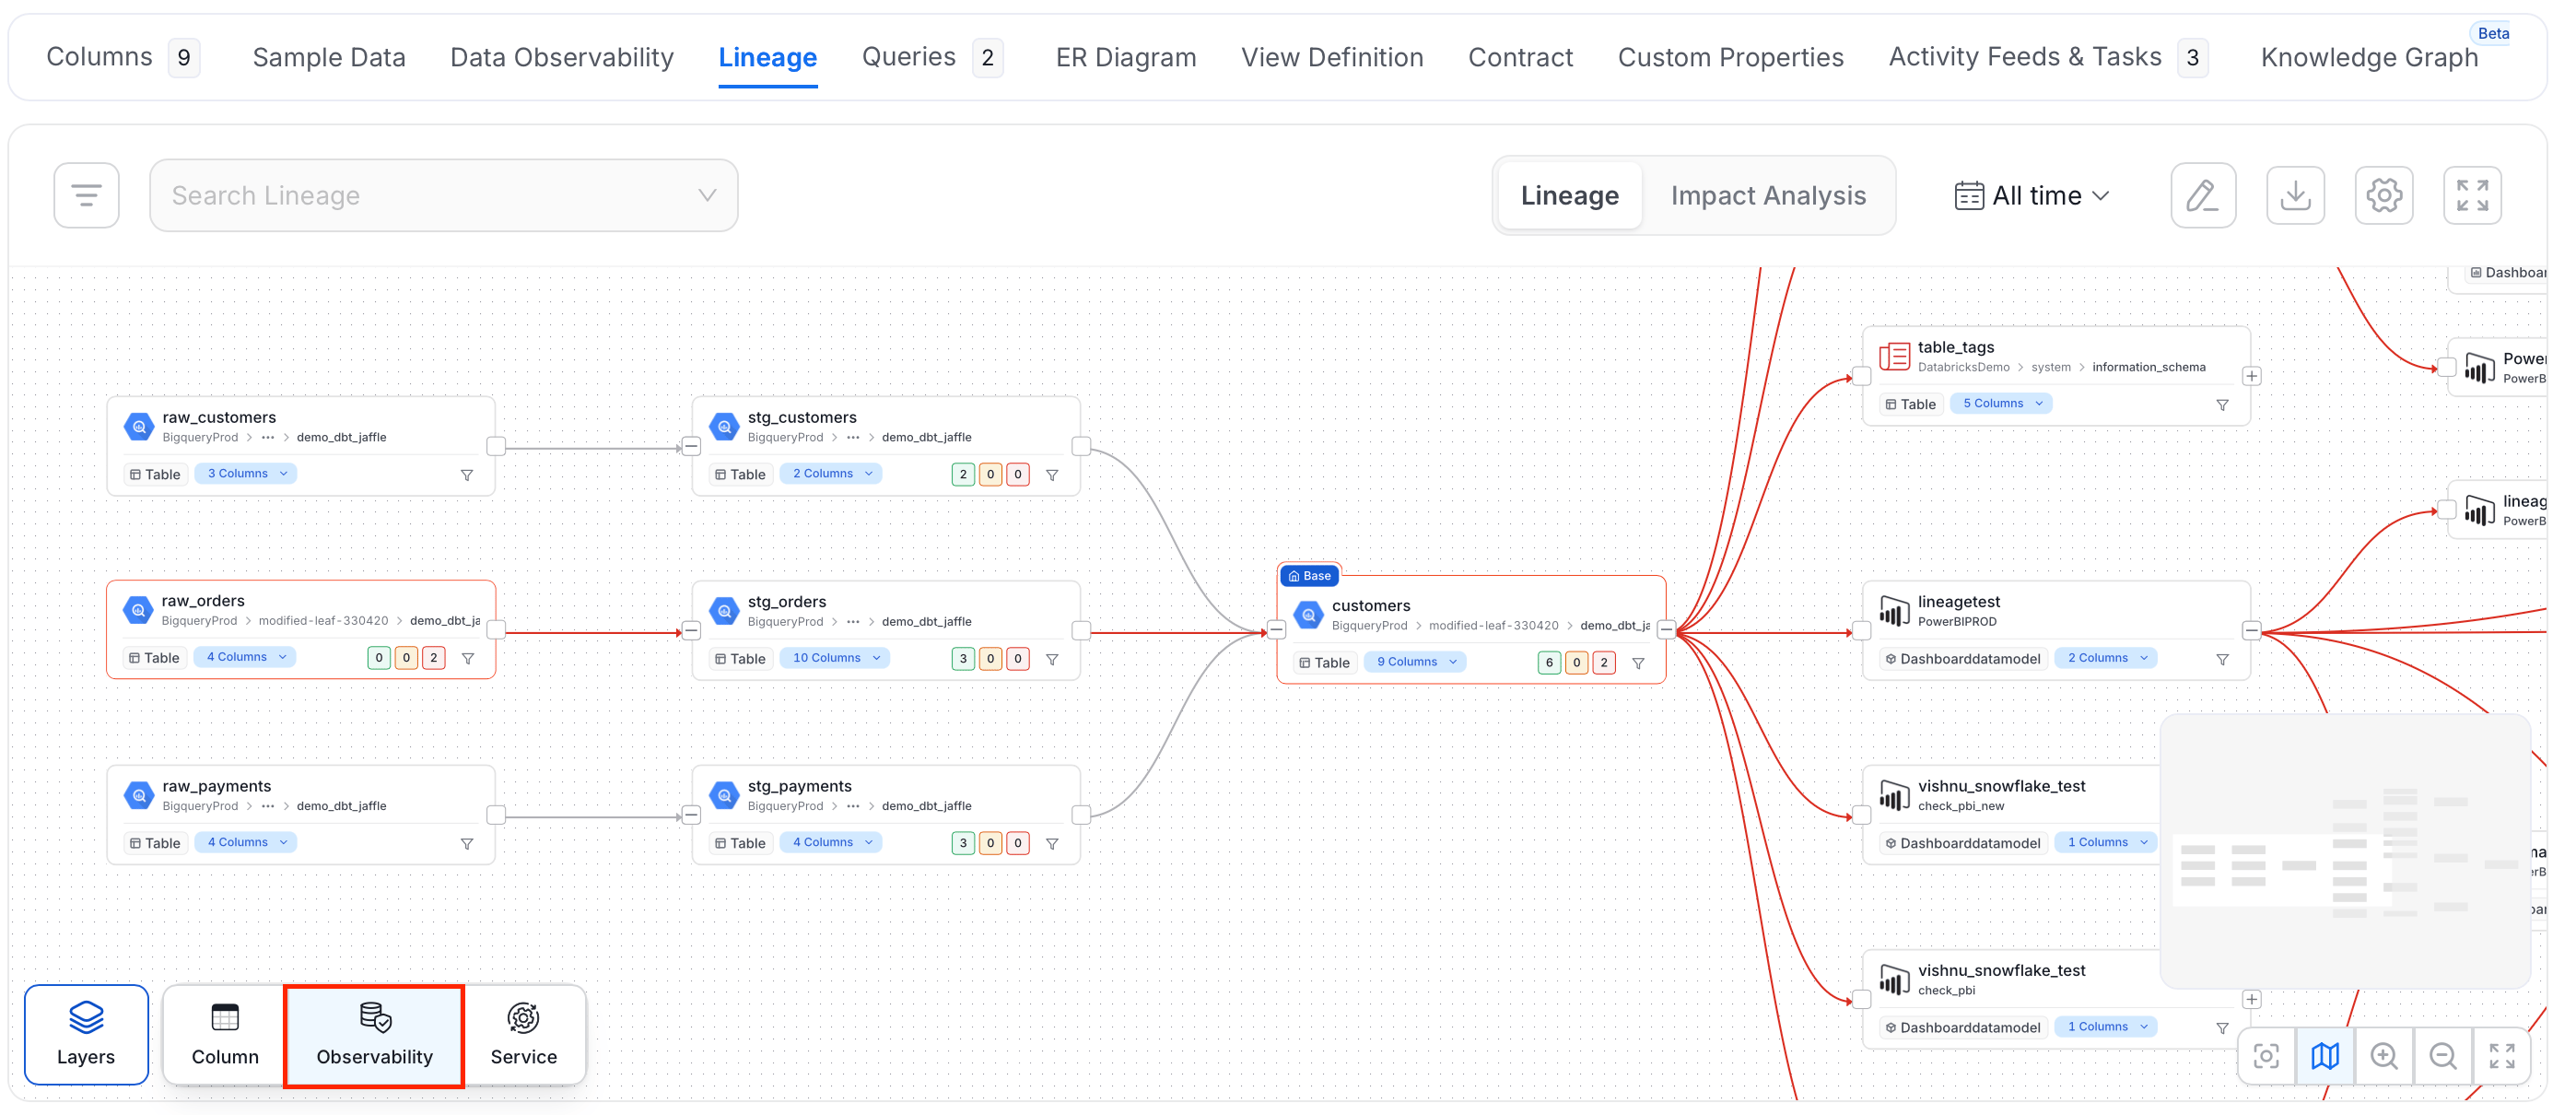
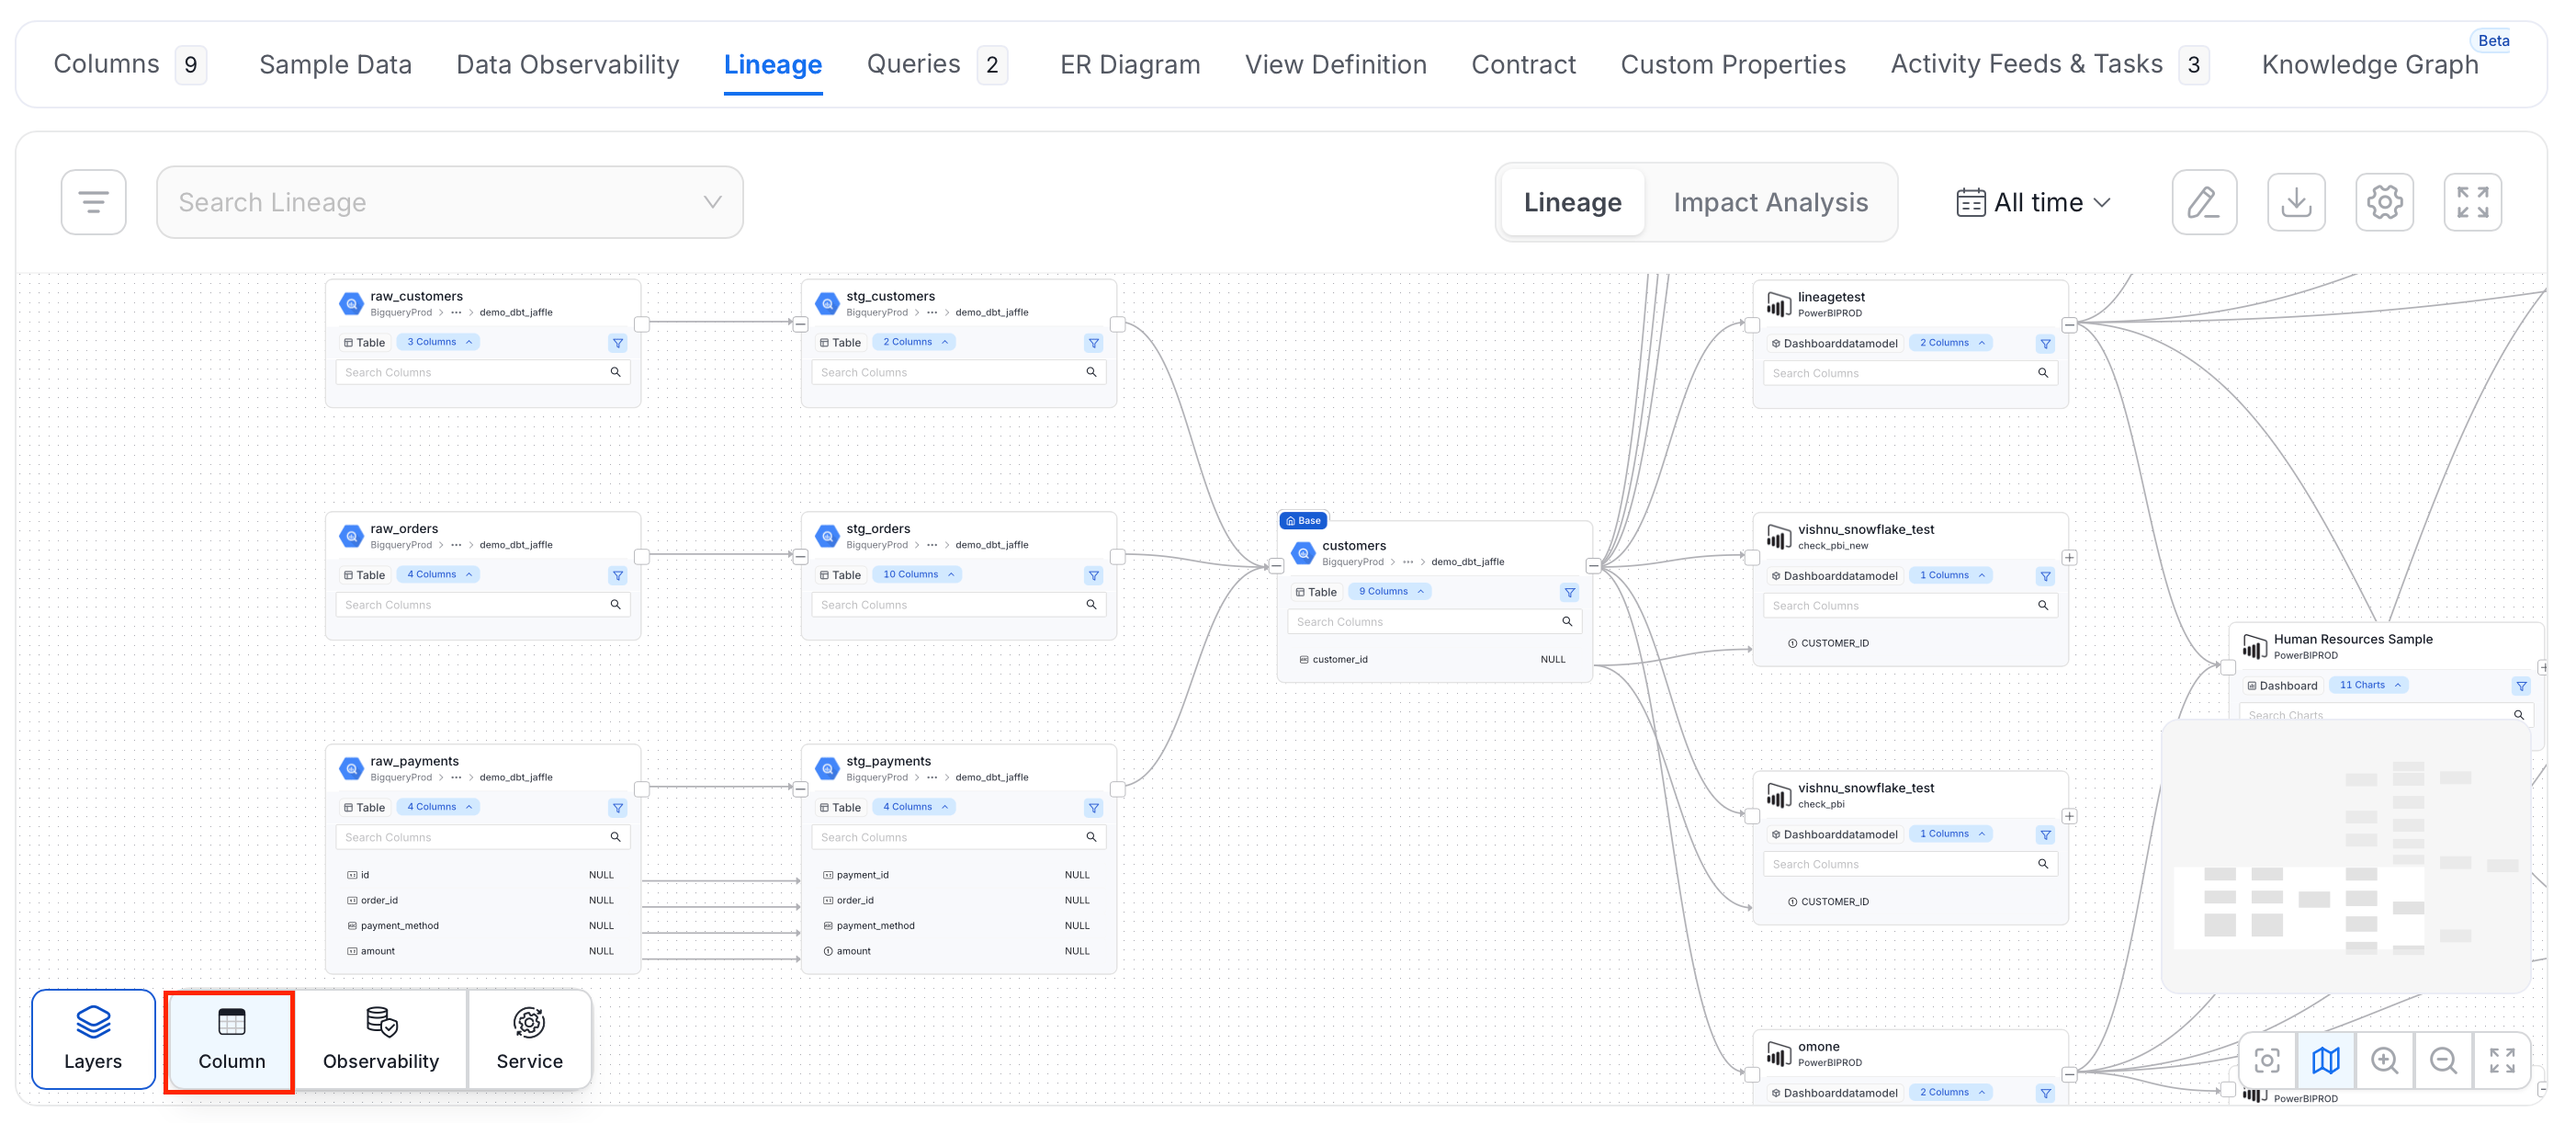 ### Observability Layer
See data quality results directly in the lineage graph — test passes, failures, and pending checks appear on each node. This helps you quickly spot which assets in the pipeline have quality issues.
### Observability Layer
See data quality results directly in the lineage graph — test passes, failures, and pending checks appear on each node. This helps you quickly spot which assets in the pipeline have quality issues.
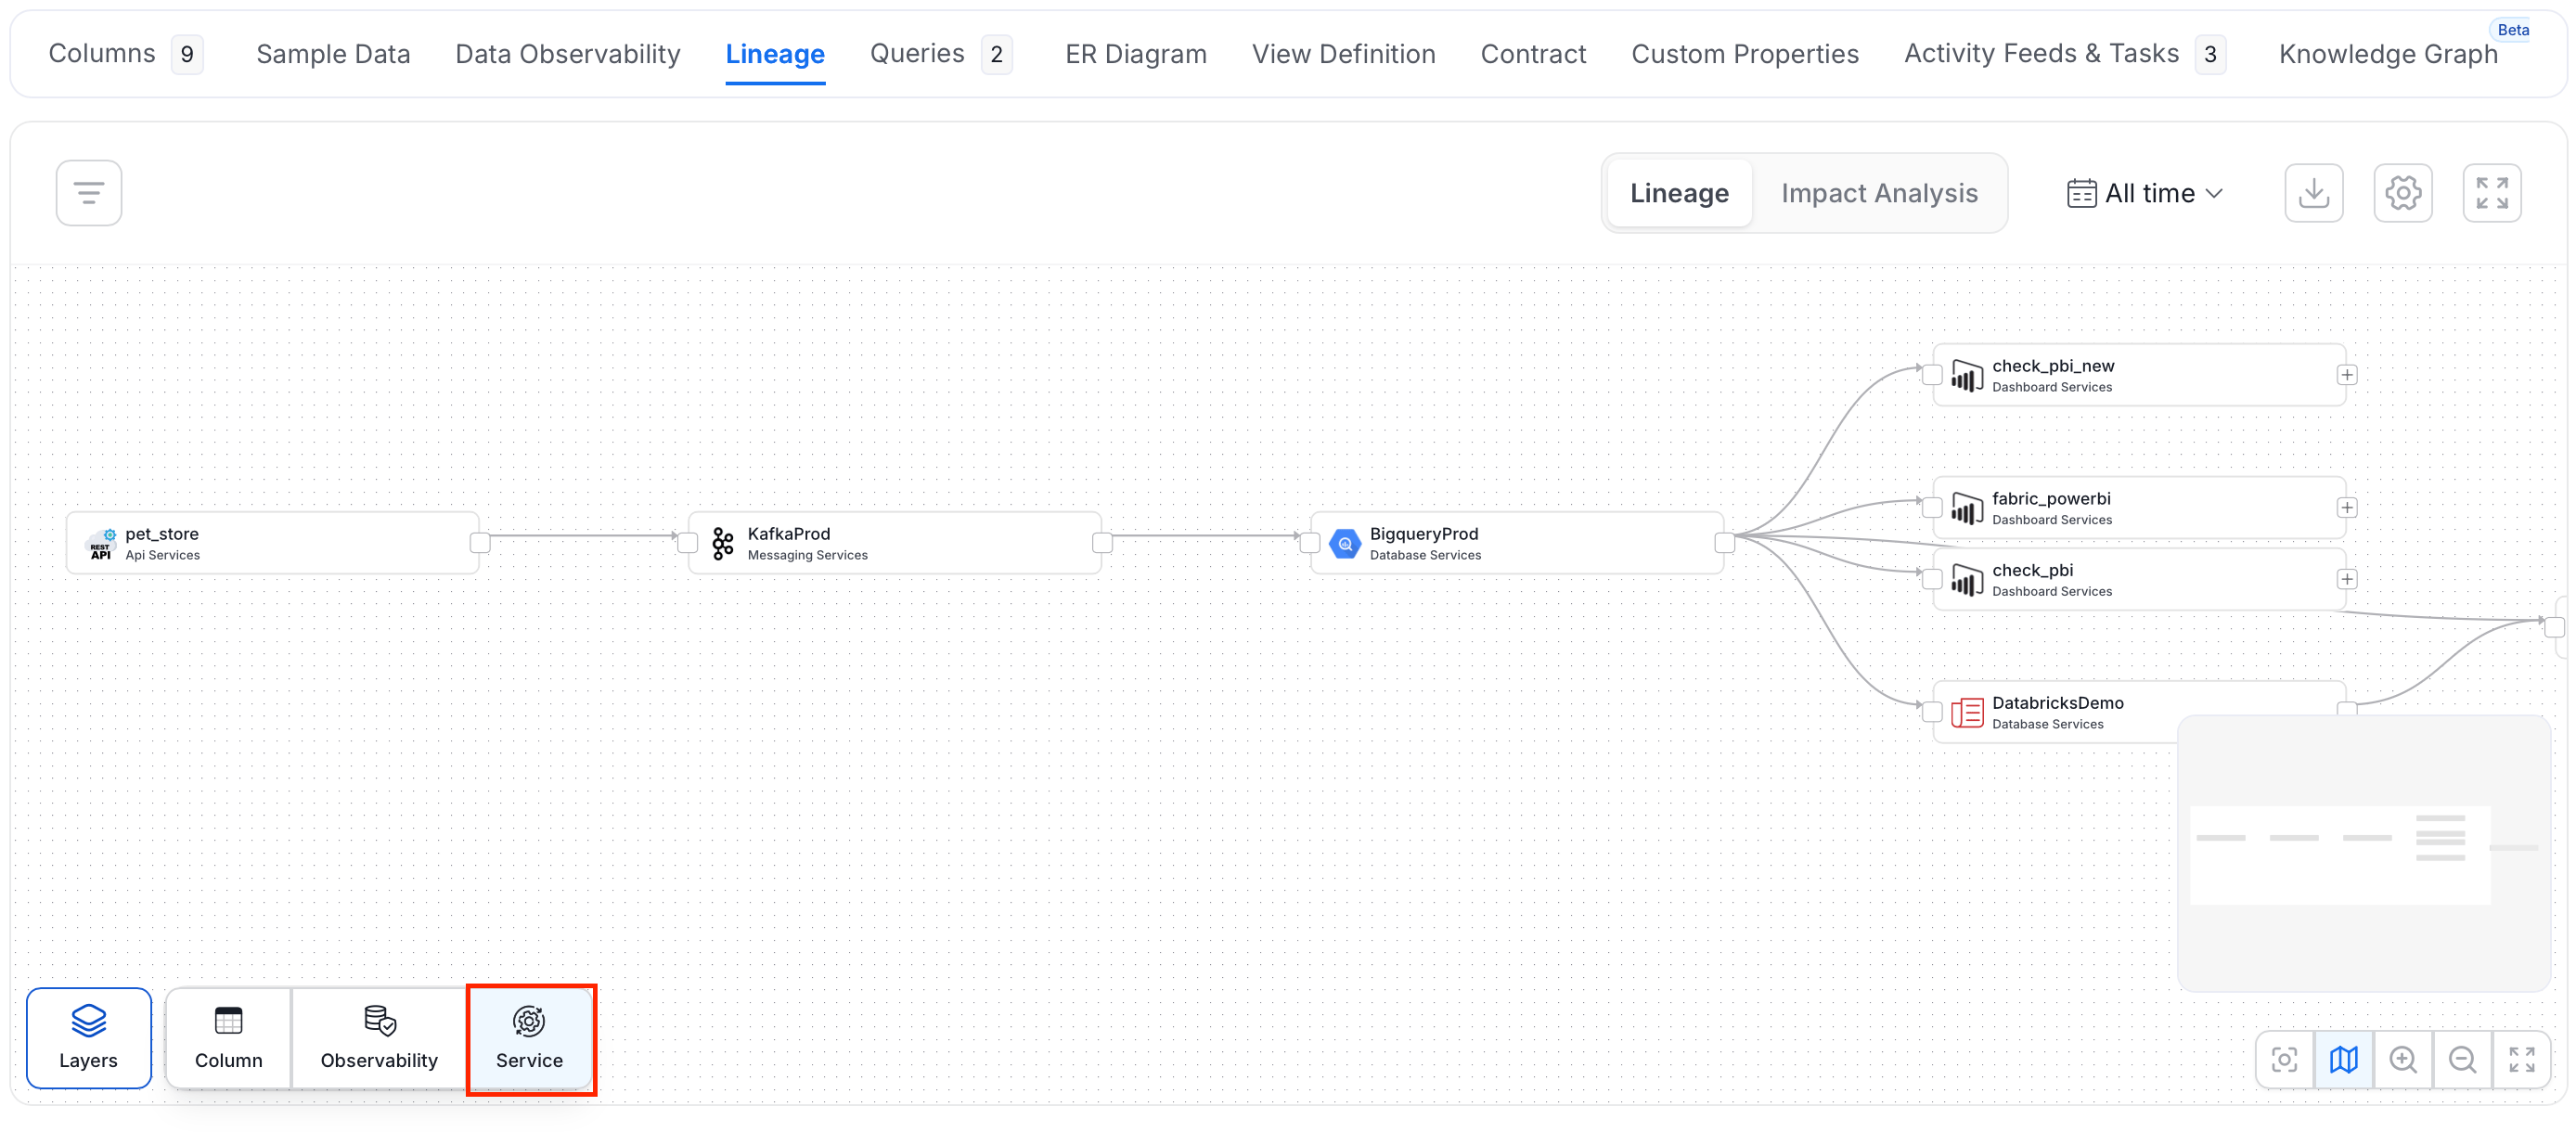
 ### Service Layer
See how data moves across services — from Hive to Redshift to Power BI to Tableau. The service layer gives you a system-level view of the full data journey, from ingestion through transformation to consumption.
### Service Layer
See how data moves across services — from Hive to Redshift to Power BI to Tableau. The service layer gives you a system-level view of the full data journey, from ingestion through transformation to consumption.
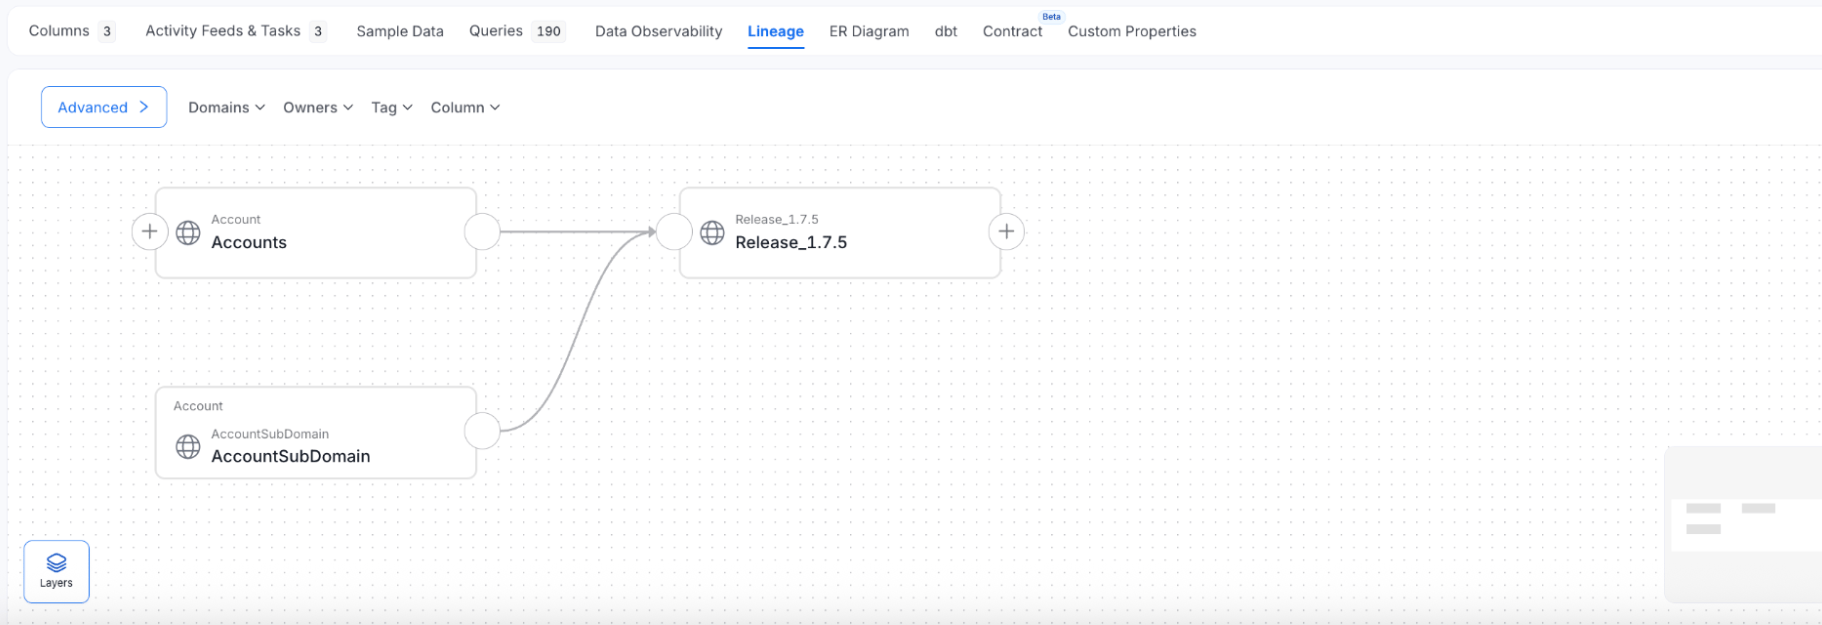
 ### Domain Layer
Group assets by business domain — like "Ecommerce" or "Customer Data" — to understand lineage in business terms. This view connects your technical assets to the business functions they support.
### Domain Layer
Group assets by business domain — like "Ecommerce" or "Customer Data" — to understand lineage in business terms. This view connects your technical assets to the business functions they support.
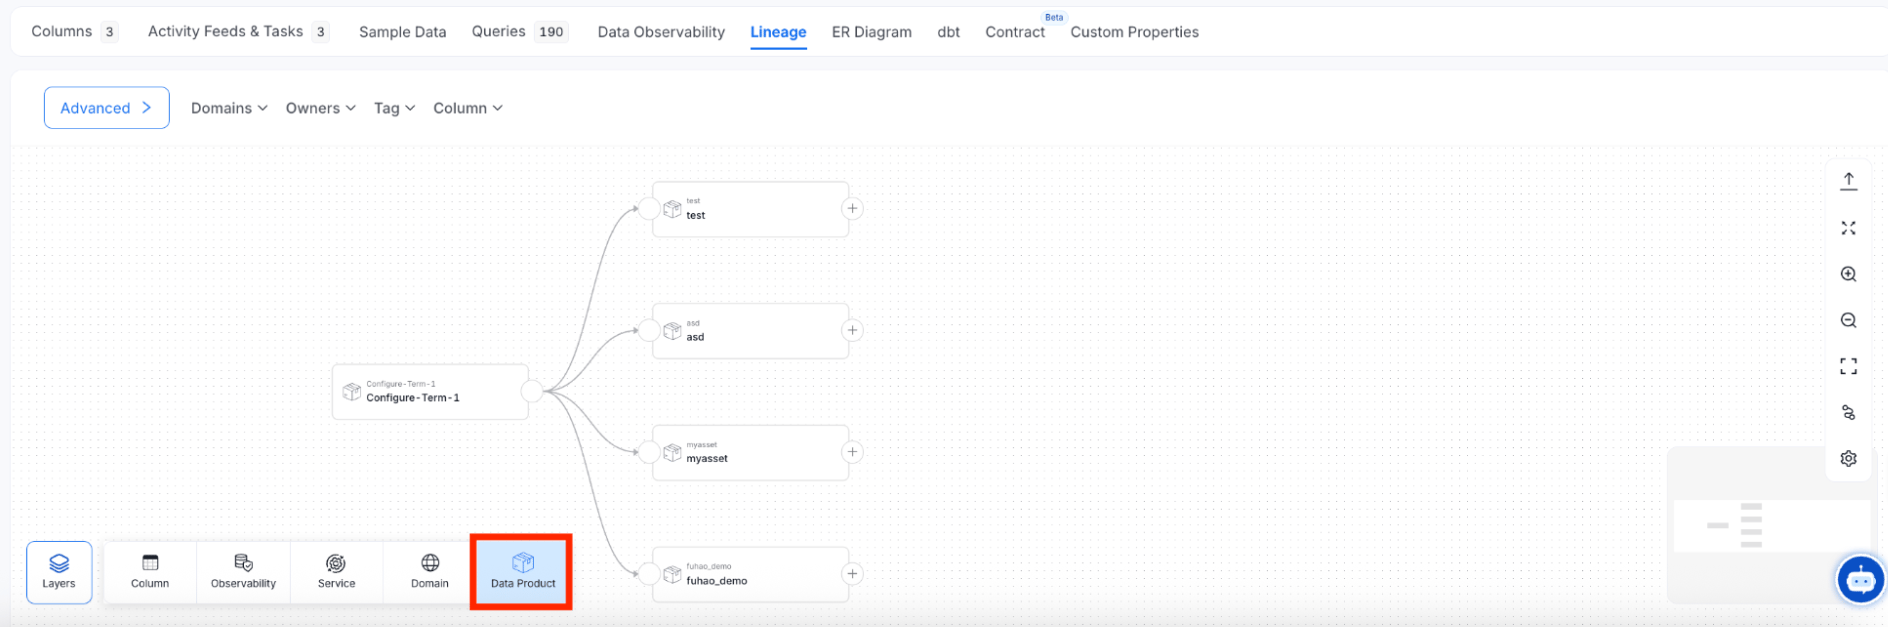
 ### Data Product Layer
See the lineage of your curated, consumption-ready data products — like *Customer Registry* or *Superstore*. The data product layer shows which trusted outputs belong to which domain and where they come from.
### Data Product Layer
See the lineage of your curated, consumption-ready data products — like *Customer Registry* or *Superstore*. The data product layer shows which trusted outputs belong to which domain and where they come from.
 Explore and edit the rich column-level lineage.